
What Is a P&L Statement in a Restaurant?
A restaurant P&L statement reveals sales, expenses, and profits, helping owners manage costs, improve margins, and plan finances more effectively.
Accounting
Aug 26, 2026
A restaurant P&L statement reveals sales, expenses, and profits, helping owners manage costs, improve margins, and plan finances more effectively.
Aug 26, 2026
RaceTrac has appointed Jill Pemberton as chief financial officer, succeeding Karla Ahlert, who moves into the newly created role of chief administrative officer.
Aug 26, 2026

Learn practical ways to reduce labour costs through smarter scheduling, forecasting, productivity, cross-training, automation, overtime control, and performance monitoring strategies.
Aug 26, 2026

Blaze Pizza welcomes Tracy Stockard as Chief Marketing Officer, bringing decades of brand and franchise experience to drive strategic growth and guest engagement.
Aug 25, 2026

Create a practical restaurant marketing plan by setting goals, targeting customers, choosing channels, budgeting wisely, scheduling campaigns, and measuring results.
Aug 24, 2026

Levain Bakery appoints Lorna Sommerville and Taya Stenson as co-CEOs, blending operational and marketing expertise to power national expansion and innovation while staying rooted in its brand values.
Aug 25, 2026

A payroll advance policy helps restaurant owners define eligibility, limits, repayment, documentation, approval procedures, and compliance requirements for employee advances.
Aug 24, 2026
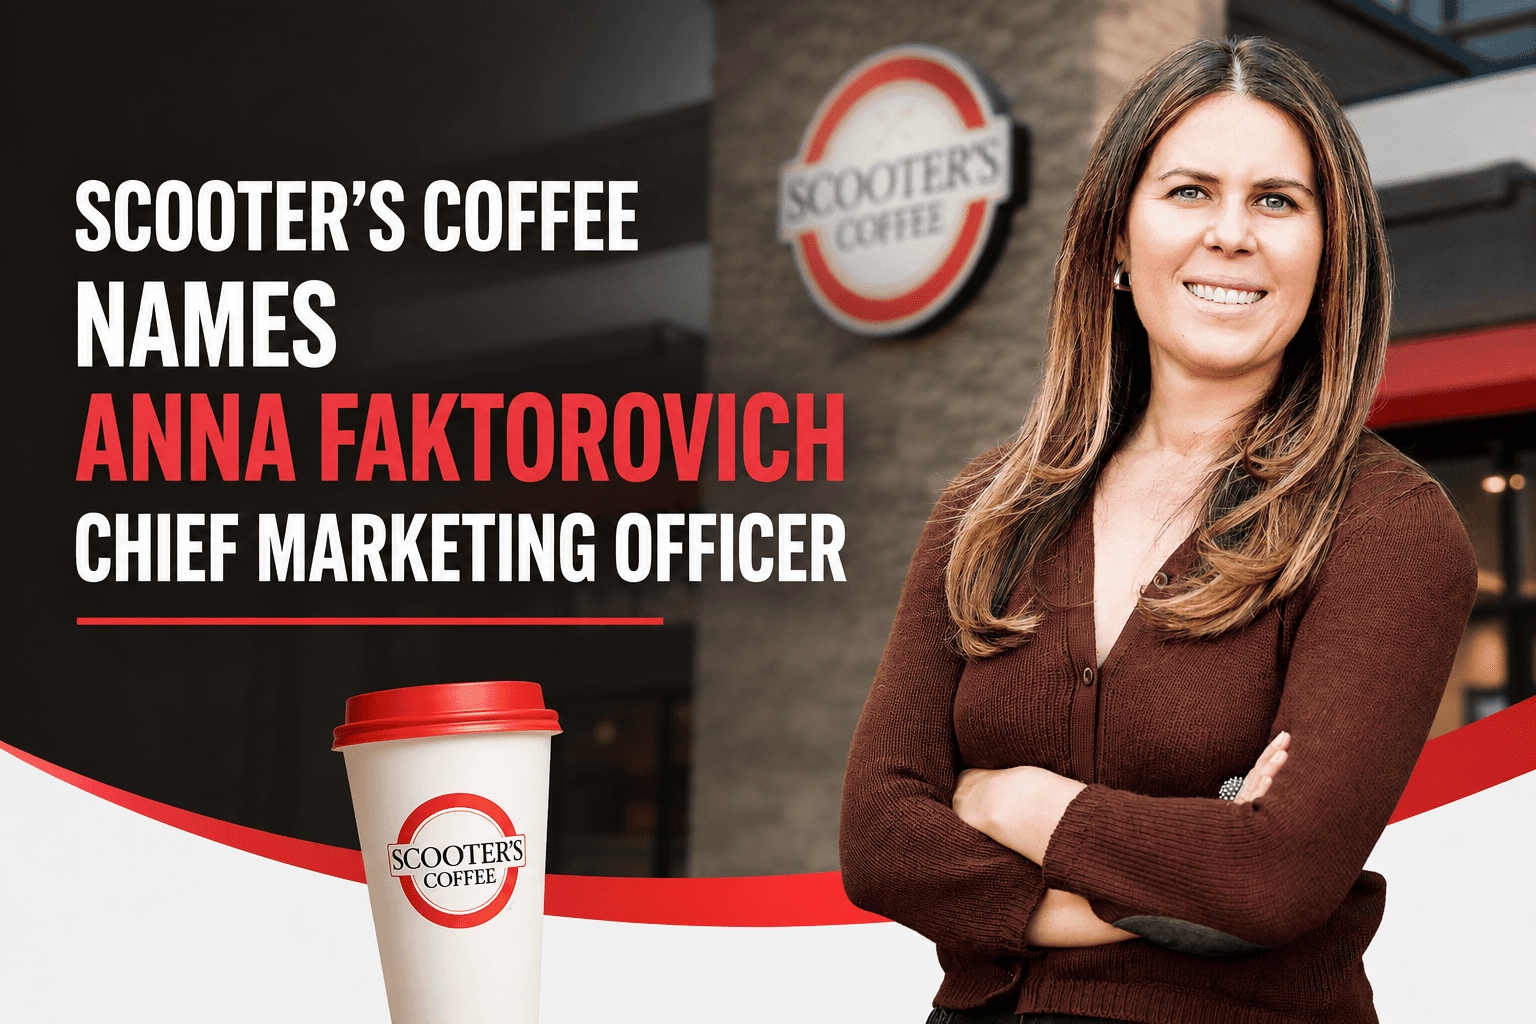
Anna Faktorovich, a seasoned marketing executive, has been named Chief Marketing Officer at Scooter’s Coffee, bringing decades of multi-brand experience to fuel the franchise’s next growth stage.
Aug 25, 2026
Wendy’s announces Tariq Hassan as Chief Marketing and Customer Growth Officer, charting a new course for brand and digital innovation. What restaurant owners can learn.
Aug 24, 2026
Dave & Buster's refreshes its executive lineup with seasoned leaders in operations, marketing, tech, and finance - signaling a growth-driven future for restaurant operators to watch.
Aug 24, 2026

Unlock Exclusive Access To Webinars, Events, And The Latest News For Free!
A restaurant P&L statement reveals sales, expenses, and profits, helping owners manage costs, improve margins, and plan finances more effectively.
A restaurant P&L statement, short for profit and loss statement, is a financial report that shows how much money your restaurant earned, how much it spent, and whether it made a profit during a specific period. It is also commonly called an income statement. For restaurant owners, the P&L statement provides a clear picture of financial performance. It brings together key numbers such as sales revenue, food and beverage costs, labor expenses, rent, utilities, marketing costs, and other operating expenses. After subtracting these costs from revenue, the statement shows whether the restaurant generated a profit or a loss. For example, if your restaurant generated $100,000 in sales during a month and had $92,000 in total expenses, the P&L statement would show an $8,000 profit. If expenses were higher than sales, the statement would show a loss instead. Most restaurant P&L statements cover a defined reporting period, such as a week, month, quarter, or year. Monthly reports are especially useful because they allow owners to monitor changes without waiting until the end of the year. A P&L statement is more than an accounting document. It can help restaurant owners answer important operational questions, including - - Are food costs increasing? - Is labor taking up too much of revenue? - Are operating expenses growing faster than sales? - Is the restaurant becoming more or less profitable? - Which costs require closer attention? By reviewing the P&L statement regularly, restaurant owners can better understand where their money is going and make more informed decisions about pricing, staffing, purchasing, budgeting, and cost control.
A restaurant P&L statement is usually organized into several financial categories that show how revenue moves through the business. Understanding these sections makes it easier to see where the restaurant earns money, where it spends money, and what remains as profit. The main sections typically include - 1. Revenue or sales - This is the money the restaurant earns from food, beverages, delivery, catering, and other sources. 2. Cost of goods sold - COGS includes the direct cost of the food, beverages, and other products sold to customers. 3. Gross profit - This is the amount left after subtracting cost of goods sold from revenue. 4. Labor costs - This section includes wages, salaries, payroll taxes, benefits, overtime, and other employee-related expenses. 5. Operating expenses - These can include rent, utilities, insurance, marketing, repairs, software, cleaning supplies, and other costs required to operate the restaurant. 6. Operating profit - This shows how much money remains after major operating expenses are deducted. 7. Net profit or loss - The final section shows whether the restaurant earned or lost money during the reporting period. Restaurant owners should pay attention to both the dollar amounts and the percentages shown on the P&L. For example, knowing that labor costs were $30,000 is useful, but knowing that labor represented 30% of sales provides additional context. Once owners understand how these sections connect, the P&L statement becomes easier to use as a practical management tool rather than simply an accounting report.

Revenue is the starting point of a restaurant P&L statement because it shows how much money the business generated during the reporting period. Restaurant owners should understand where this revenue comes from and how different sales categories contribute to overall performance. Common revenue categories may include - 1. Food sales - Revenue generated from appetizers, entrees, desserts, and other menu items. 2. Beverage sales - Income from soft drinks, coffee, alcoholic beverages, and other drinks. 3. Online and delivery sales - Revenue generated through direct online ordering platforms or third-party delivery services. 4. Catering and event sales - Income from catering orders, private events, or group bookings. 5. Other revenue - This may include merchandise, service charges, gift card-related revenue, or other restaurant-specific income. Restaurant owners should also understand the difference between gross sales and net sales. Gross sales represent total sales before deductions, while net sales reflect adjustments such as discounts, refunds, promotions, and certain other reductions. Breaking revenue into categories can help owners identify which parts of the business are growing and which may be declining. For example, rising delivery sales combined with falling dine-in sales could indicate a change in customer behavior that affects staffing, packaging, and marketing decisions. Owners should also compare revenue across different periods, such as month over month or year over year. Tracking these patterns makes it easier to recognize seasonality, measure growth, and identify unusual changes. Accurate revenue reporting gives the rest of the P&L statement context. Without reliable sales data, restaurant owners cannot accurately evaluate food costs, labor percentages, operating expenses, or overall profitability.
Cost of goods sold, or COGS, represents the direct cost of the food and beverages a restaurant sells. It is one of the most important sections of a restaurant P&L statement because even small increases in ingredient costs can significantly affect profitability. Restaurant COGS commonly includes items such as - 1. Food ingredients - Meat, produce, dairy, dry goods, sauces, and other ingredients used to prepare menu items. 2. Beverages - Soft drinks, coffee, beer, wine, liquor, and other beverages sold to customers. 3. Other directly consumed products - Depending on the restaurant, this may include certain packaging or consumable items tied directly to sales. A common way to calculate COGS is - Beginning Inventory + Purchases - Ending Inventory = Cost of Goods Sold For example, if a restaurant starts the month with $12,000 in inventory, purchases $28,000 in food and beverages, and ends with $10,000 in inventory, its COGS would be $30,000. Restaurant owners should also monitor COGS as a percentage of sales - COGS Percentage = COGS / Net Sales x 100 If COGS rises faster than revenue, it can reduce gross profit. Possible causes include higher supplier prices, food waste, overportioning, theft, inaccurate inventory counts, or poor purchasing practices. Reviewing COGS regularly helps owners identify cost changes early. Comparing actual food and beverage costs with previous periods, budgets, and menu pricing can also reveal whether adjustments are needed. Because food and beverage costs are major controllable expenses, understanding COGS helps restaurant owners use their P&L statement to make better purchasing, inventory, portioning, and pricing decisions.
After reviewing sales and cost of goods sold, restaurant owners should look closely at labor and operating expenses. These costs can take up a large share of revenue and have a major effect on profitability. Labor expenses may include - 1. Hourly wages - Pay for servers, cooks, dishwashers, hosts, bartenders, and other hourly employees. 2. Salaries - Compensation for managers, chefs, and other salaried team members. 3. Payroll taxes - Employer-paid taxes associated with employee wages. 4. Employee benefits - Health insurance, paid time off, retirement contributions, and other benefits. 5. Overtime - Additional wages paid when employees work beyond standard hours. Operating expenses include the other costs required to keep the restaurant running. Common examples are rent, utilities, insurance, marketing, maintenance, cleaning supplies, software subscriptions, licenses, and professional services. Owners should review these expenses both as dollar amounts and as a percentage of sales. If labor costs remain flat while sales fall, for example, labor percentage will increase and put pressure on margins. Likewise, rising utility, repair, or software expenses can gradually reduce profitability if they are not monitored. The goal is not simply to cut expenses as much as possible. Reducing labor or operating costs too aggressively can hurt service quality, food safety, employee productivity, and the guest experience. A restaurant P&L statement helps owners identify where costs are increasing and determine which expenses are necessary, controllable, or potentially excessive. Regular review can support better decisions around scheduling, staffing, vendor contracts, purchasing, and overall restaurant budgeting.

A restaurant P&L statement helps owners see not only how much revenue the business generates, but also how much money remains after different expenses are deducted. Two important figures to understand are gross profit and net profit. Gross profit is the amount left after subtracting cost of goods sold from net sales. Gross Profit = Net Sales - Cost of Goods Sold For example, if a restaurant generates $100,000 in net sales and has $30,000 in COGS, its gross profit is $70,000. This amount must still cover labor, rent, utilities, marketing, insurance, and other operating expenses. Operating profit goes a step further by showing what remains after operating expenses are deducted. This gives owners a clearer view of how efficiently the restaurant's core operations are performing. Net profit is the final amount left after all applicable expenses are accounted for. If the number is positive, the restaurant earned a profit. If it is negative, the restaurant operated at a loss during that period. Owners should also monitor net profit margin - Net Profit Margin = Net Profit / Net Sales x 100 This percentage makes it easier to compare profitability across different periods, even when sales levels change. Strong sales do not always mean strong profits. A restaurant may generate high revenue but still struggle financially if food costs, labor, rent, or other expenses are too high. By understanding gross profit, operating profit, and net profit, restaurant owners can use their P&L statement to see how effectively sales are being converted into actual earnings.
Once restaurant owners understand the main sections of a P&L statement, the next step is learning how to analyze the numbers. A useful P&L review should go beyond checking whether the restaurant made a profit. Owners should look for trends, unusual changes, and expenses that are growing faster than sales. Start by comparing the current reporting period with previous periods. Month-over-month and year-over-year comparisons can help reveal whether revenue, food costs, labor expenses, and profit margins are improving or declining. Restaurant owners should also review key expenses as a percentage of sales. For example - Food Cost Percentage = Food Cost / Food Sales x 100 Labor Cost Percentage = Labor Cost / Net Sales x 100 Net Profit Margin = Net Profit / Net Sales x 100 Percentages make it easier to evaluate performance when sales fluctuate. A restaurant may spend more on labor in dollar terms during a busy month, but the labor percentage could still improve if sales increase faster. Owners should watch for warning signs such as - - Food costs increasing without a corresponding increase in menu prices - Labor costs rising faster than sales - Operating expenses consistently exceeding budget - Gross profit declining over several periods - Strong sales growth without an improvement in net profit Comparing actual results with budgets or forecasts can provide additional context. If an expense is significantly higher than expected, owners can investigate the cause and determine whether corrective action is necessary. Regular P&L analysis helps turn financial data into practical information restaurant owners can use to manage costs, protect margins, and make better operating decisions.
A restaurant P&L statement is most valuable when owners use the information to guide everyday business decisions. Instead of viewing the report only as an accounting requirement, restaurant owners can use it to identify financial problems, set priorities, and improve profitability. For example, if food costs are increasing faster than sales, owners may need to review supplier pricing, portion sizes, waste, inventory practices, or menu prices. If labor costs are rising, they can evaluate scheduling, overtime, productivity, and staffing levels. A P&L statement can also support decisions related to - 1. Menu pricing - Review food costs and margins to determine whether certain menu prices need adjustment. 2. Staffing - Compare labor costs with sales to create schedules that better match expected demand. 3. Purchasing - Monitor COGS and supplier expenses to identify opportunities for better purchasing decisions. 4. Budgeting - Use historical revenue and expense data to create more realistic operating budgets. 5. Expense control - Identify categories where spending is consistently increasing or exceeding expectations. 6. Profit planning - Track margins and determine how changes in sales or expenses could affect overall profitability. Restaurant owners should review their P&L statement on a consistent schedule rather than waiting until financial problems become obvious. Monthly reviews are common, while some operators also track key revenue and cost figures weekly for faster visibility. The P&L should also be considered alongside operational information such as sales trends, inventory levels, labor hours, guest traffic, and menu performance. Combining financial and operational data gives owners a more complete picture of how the restaurant is performing. By regularly reviewing and acting on the information in the P&L statement, restaurant owners can make more informed decisions, control costs more effectively, and strengthen the financial health of their business.