Taco Bell Franchise Expansion in Midwest
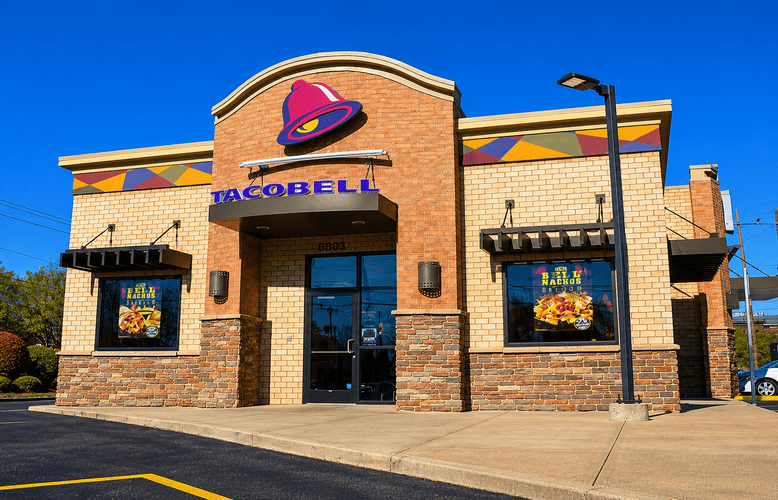
Southpaw adds 43 Ohio Taco Bell restaurants to its impressive portfolio, highlighting franchise growth and strengthening the Midwest QSR landscape.
news
Jun 26, 2026
Southpaw adds 43 Ohio Taco Bell restaurants to its impressive portfolio, highlighting franchise growth and strengthening the Midwest QSR landscape.
Jun 26, 2026
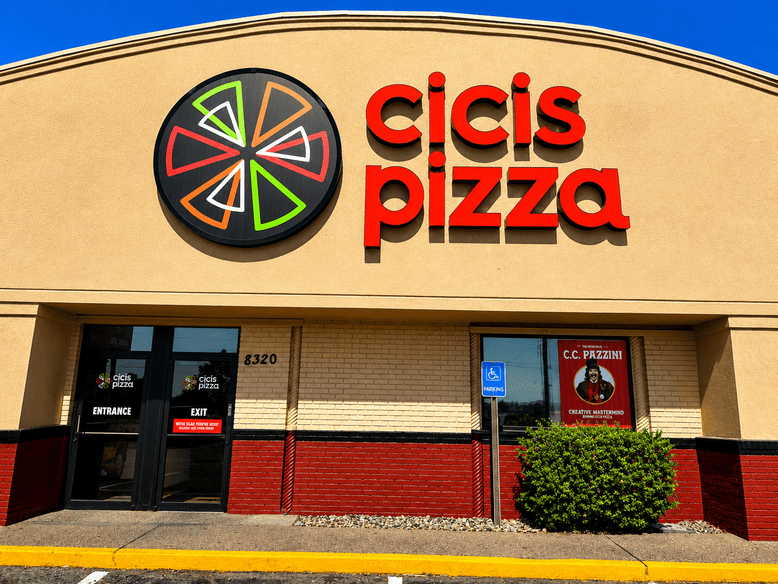
Discover how Cicis Pizza's rewards program skyrocketed to over one million members in under a year, driving customer engagement and retention. See the lessons for restaurant loyalty programs.
Jun 26, 2026
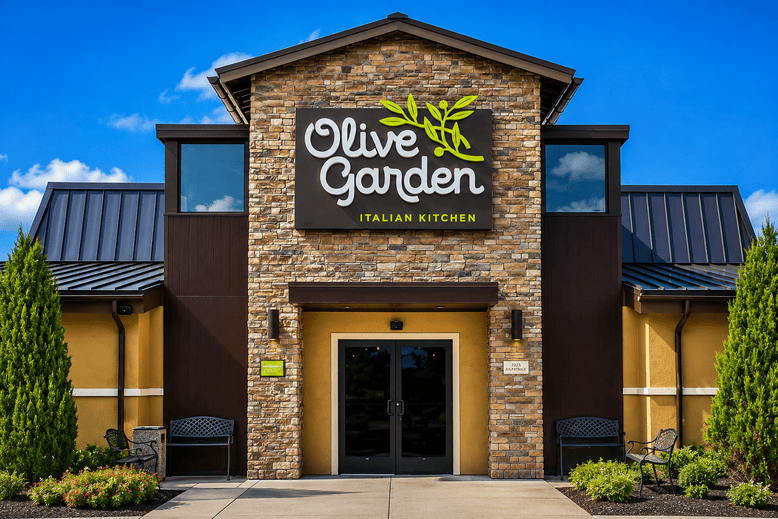
Darden Restaurants surpassed $13 billion in sales, fueled by robust performance at LongHorn Steakhouse and innovative menu changes at Olive Garden. Explore the strategies driving this industry giant’s continued dominance.
Jun 26, 2026
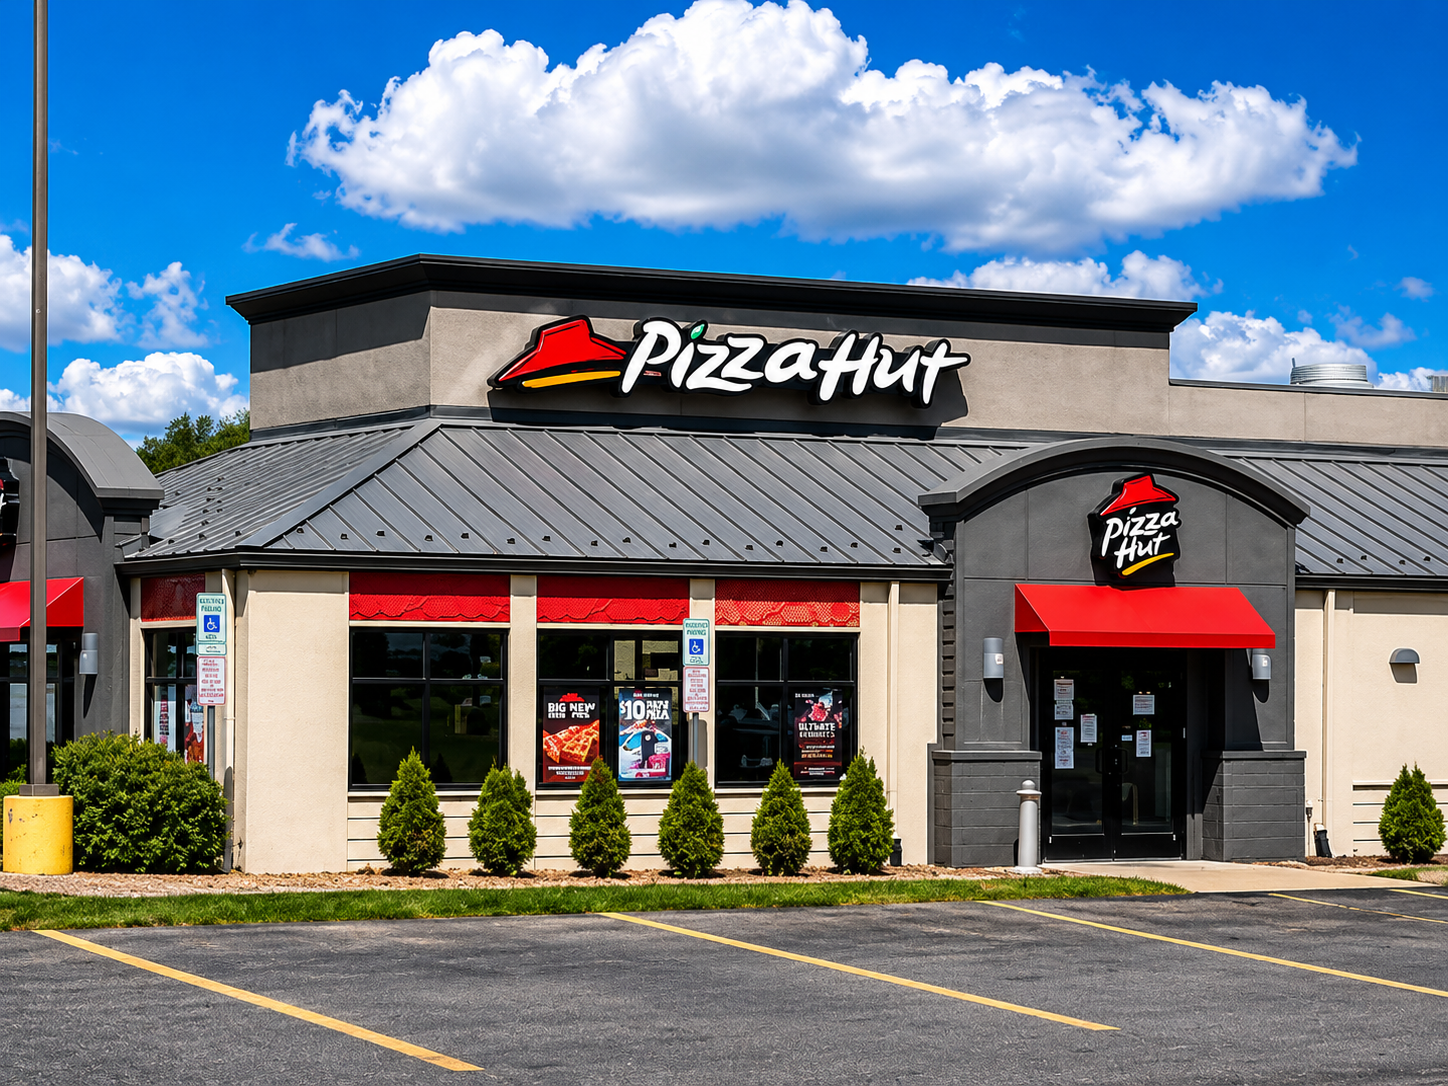
The fallout of Pizza Hut's mandated AI delivery system rollout has ignited a $100 million lawsuit from a leading franchisee, highlighting crucial franchisor-franchisee lessons for all restaurant owners.
Jun 26, 2026
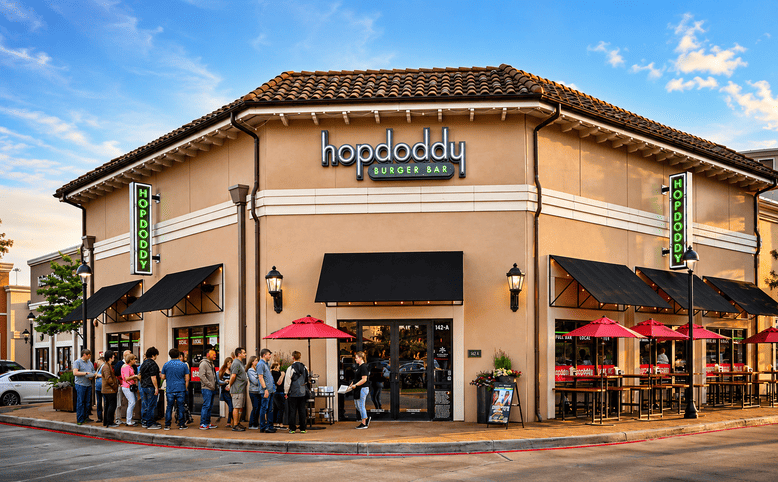
Founders Table Restaurant Group acquires fast-casual leader Hopdoddy Burger Bar, expanding its reach to over 200 restaurants and accelerating operational growth across the platform.
Jun 25, 2026
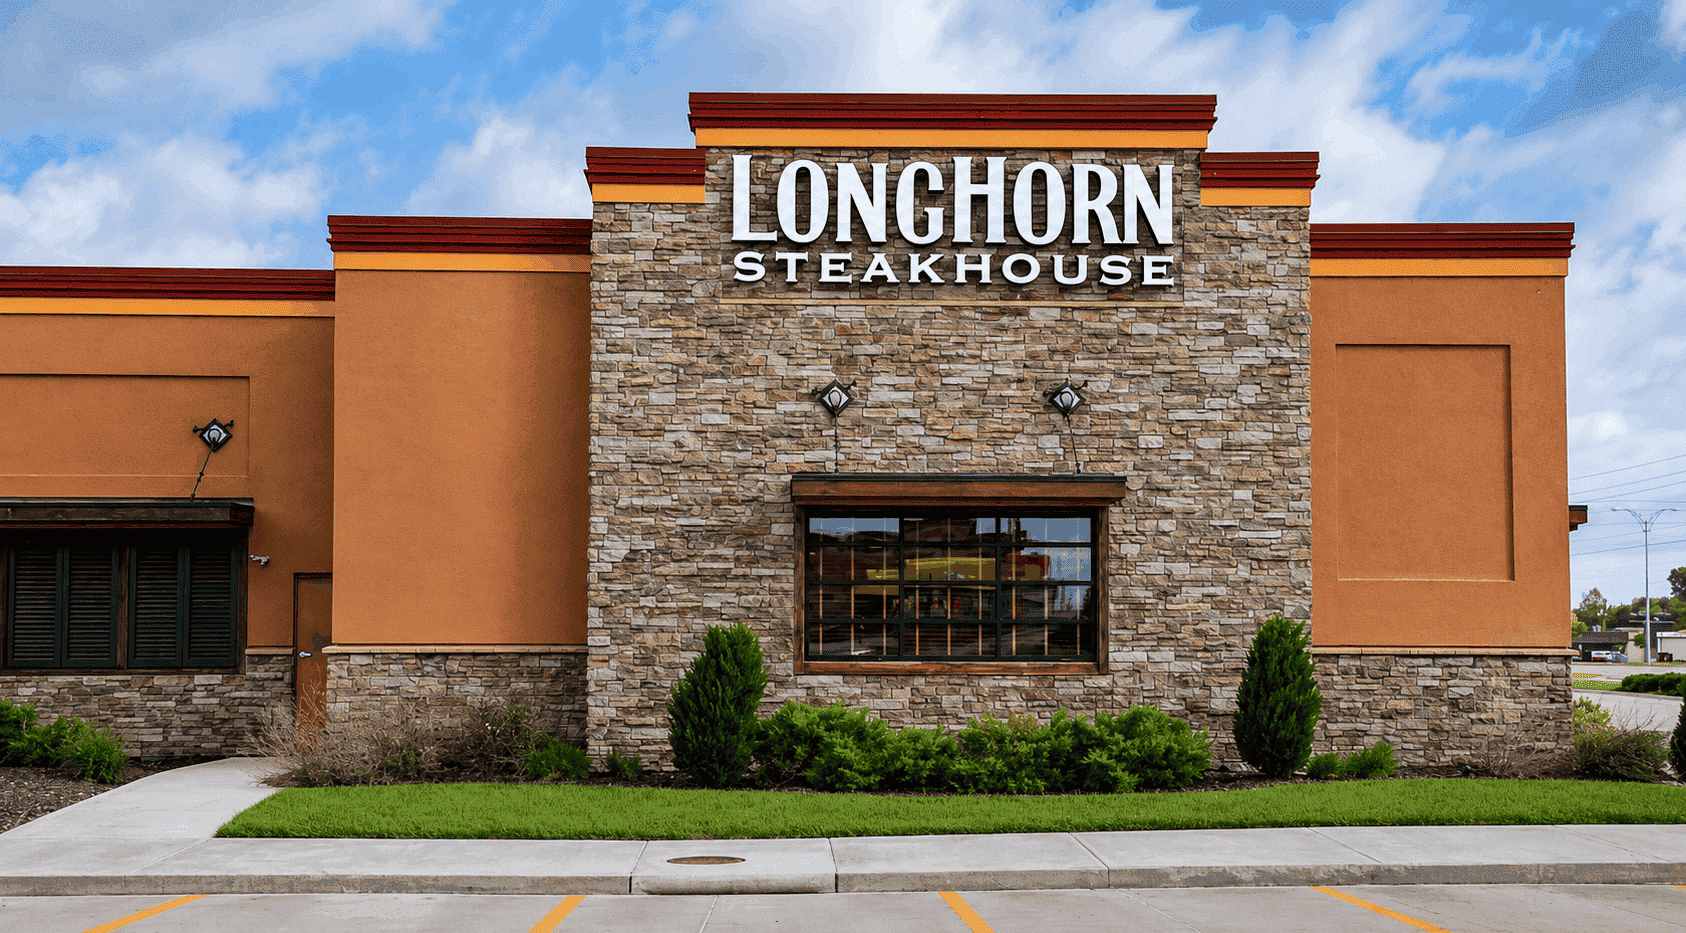
LongHorn Steakhouse surpassed $1 billion in quarterly sales for the first time, driven by strong value perception and menu innovation. Restaurant leaders can draw key lessons for thriving when consumer price sensitivity is high.
Jun 25, 2026
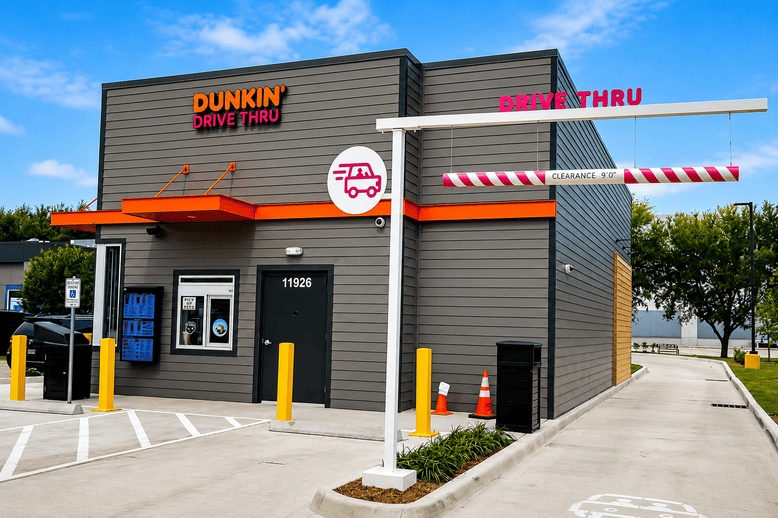
Inspire Brands is preparing for an IPO aiming for a $20B valuation. Discover how giants like Arby’s, Sonic, and Dunkin’ are performing as part of this dynamic portfolio.
Jun 25, 2026
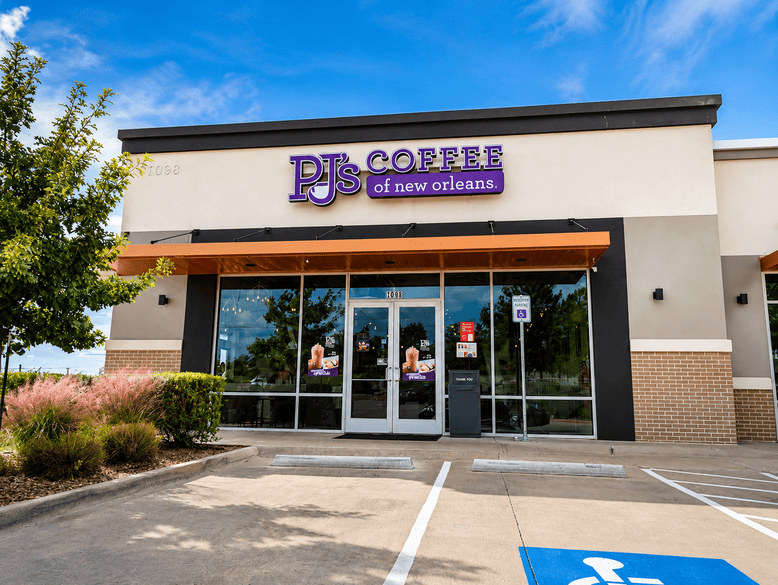
Estepp Energy, known for multi-unit brands like Little Caesars, is adding PJ's Coffee to its Kentucky convenience stores, marking a strategic expansion into specialty coffee.
Jun 24, 2026
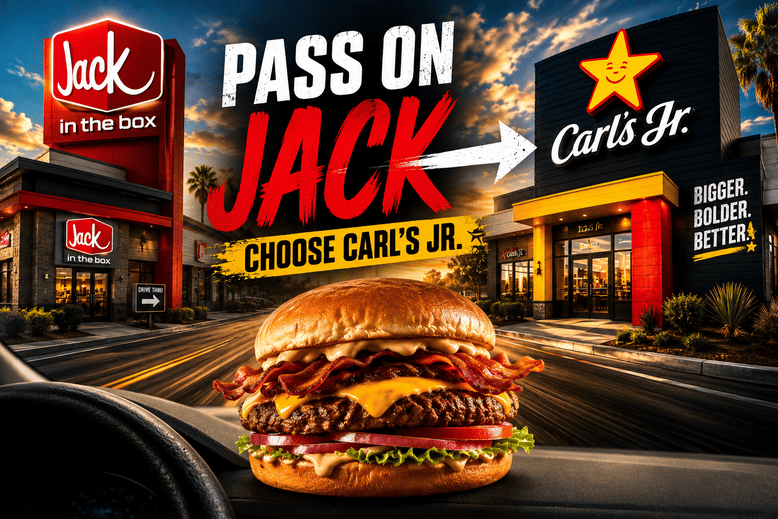
Carl's Jr. has launched a "Pass on Jack" marketing campaign rewarding loyalty members with a free Sourdough Star burger for driving past a Jack in the Box to reach a Carl's Jr. location- a direct shot at its California-based burger rival.
Jun 24, 2026
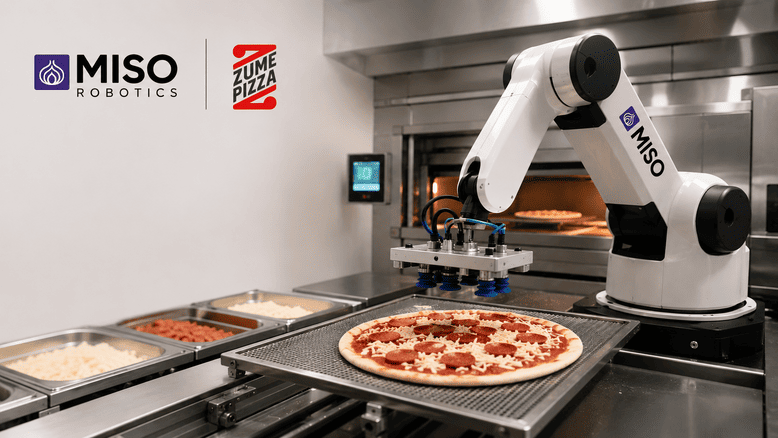
Miso Robotics has acquired Zume Pizza’s technology deck, giving new life to pizza automation and food robotics for forward-thinking restaurant operators.
Jun 24, 2026
Learn which restaurant KPIs truly matter, why weekly tracking matters, and how to build an actionable dashboard to protect margins and drive profitability.
Picture this scenario - It is the 18th of the month. You finally receive last month's Profit & Loss (P&L) statement from your external bookkeeper. You open the file expecting to see a solid profit after a seemingly busy month, only to discover a net loss. Panic sets in. Digging into the numbers, you realize your kitchen was over-portioning the new premium steak special, and your floor managers consistently failed to cut staff during slow Tuesday shifts, resulting in a massive overtime spike. The most tragic part of this scenario? It is entirely too late to fix it. The food is already gone, the overtime checks have already been cashed, and the cash flow is gone forever. Operating a multi-unit restaurant group by staring at a 30-day-old P&L is the equivalent of driving down the highway while only looking in the rearview mirror. To survive and scale in the foodservice industry, you need a forward-looking dashboard. You must understand exactly what restaurant KPIs actually matter and how to track them weekly so you can stop financial bleeding before it becomes fatal. Let’s step away from the daily grind and examine this like the strategic business operator you are. Here is the unvarnished truth about building an operational dashboard, extracting the right data, and keeping your margins intact.
A KPI, or Key Performance Indicator - is simply a measurable data point that reveals the health of your business at a specific moment in time. In a traditional corporate office, waiting until the end of the month to review finances might be acceptable. In a restaurant, it is a death wish. Your primary assets labor and inventory are highly volatile and highly perishable. A broken walk-in cooler can wipe out your profit margin overnight. A sudden weather event can leave your dining room empty while your fully-staffed kitchen burns through labor dollars by the minute. Weekly KPI tracking pulls you out of the dark. It empowers you to act as a "circuit breaker" for bad operational habits. If you realize on Sunday night that your scheduled labor cost spiked to 38% over the weekend, you can immediately trim hours for the upcoming Wednesday lunch shift to balance the weekly budget. You stop managing by gut feeling and start managing by objective data.
You do not need to track fifty different data points to run a profitable restaurant empire. In fact, drowning your management team in data leads to operational paralysis. A modern, clean reporting structure focuses on a few high-impact metrics. Here are the core indicators that dictate your profitability.
Understanding the metrics is only half the battle. The operational challenge is extracting this data efficiently. If your general managers are spending four hours every Monday morning manually typing numbers from physical receipts into a spreadsheet, your system is broken. To master what restaurant KPIs actually matter and how to track them weekly, you must build an automated extraction pipeline. Modern multi-unit operators do not rely on manual data entry. The Automated Extraction Pipeline -
Consider the case of a rapidly expanding three-unit gastropub concept. The operations director noticed that overall profitability was shrinking despite top-line sales growing. Because they only reviewed a consolidated monthly P&L, they could not pinpoint the leak. They implemented a strict weekly KPI tracking system, piping data from their POS and scheduling platforms directly into a master tracking sheet every Monday morning. The Discovery - In week two of tracking, the data revealed a glaring anomaly at Location B. While Location A and C were running a 29% labor cost, Location B hit 36%. Digging into the schedule variance, the director found that Location B’s General Manager was consistently scheduling three line cooks and a prep cook for Tuesday and Wednesday lunch shifts shifts that historical POS data proved only required two cooks total. The Action - The operations director immediately adjusted the template in their scheduling software, capping the allowable hours for mid-week lunches at Location B. The Result - By catching the error in week two rather than at the end of the month, the operator saved an estimated $1,800 in wasted payroll for the remainder of that single month. Over the course of a year, that single weekly data pull added over $20,000 back to the company’s bottom line.
Even highly capable operators stumble when trying to build a data-driven culture. Avoid these notorious pitfalls that turn number-crunching into a frustrating waste of time. Mistake 1- Confusing "Sales" with Actual Cash Flow Your POS dashboard might proudly declare that you had a massive $40,000 week. However, if $2,500 of that was comped meals due to kitchen errors, $1,000 was paid for with old gift cards, and you owe $3,000 in third-party delivery commissions, your actual usable cash flow is drastically different. When tracking your KPIs, ensure your data extraction filters out comps, voids, and unearned revenue. You must calculate your percentages based on actual, bankable dollars. Mistake 2- Hoarding the Data in the Executive Office Many owners calculate their Prime Cost every Monday, realize it is wildly off target, get angry in their office, and never share the granular numbers with the staff. Your Kitchen Manager cannot fix a 34% food cost if they do not know it exists. Your Bar Manager cannot fix a pouring variance if they never see the liquor cost percentage. You must democratize your data. Share the weekly KPIs with your unit-level leadership. Give them a numerical target to beat, and tie their bonus structures directly to those weekly metrics. Mistake 3- Skipping the Weekly "Flash" Inventory Tracking your weekly purchases is simple, but if you do not physically count the high-value goods sitting on your shelves, your COGS percentage is lying to you. If you buy a $600 case of wagyu beef on Thursday, a purely purchase-based system makes your weekly food cost look apocalyptic. If you only sold $100 worth of it, you must account for the remaining $500 still sitting in your walk-in as an asset. You do not have to count paper napkins weekly, but you must count your critical, high-dollar inventory.
Taking total control of your numbers can feel intimidating, especially if you entered the restaurant business because you are passionate about hospitality and food, not spreadsheets and data extraction pipelines. However, mastering the financial mechanics of your business is the ultimate form of hospitality. It is how you ensure you can keep your doors open, provide a livelihood for your staff, and continue scaling your brand. Stop relying on the month-end rearview mirror. Implement this weekly operational routine to stabilize your margins-