Taco Bell Franchise Expansion in Midwest
Southpaw adds 43 Ohio Taco Bell restaurants to its impressive portfolio, highlighting franchise growth and strengthening the Midwest QSR landscape.
news
Jun 26, 2026
Southpaw adds 43 Ohio Taco Bell restaurants to its impressive portfolio, highlighting franchise growth and strengthening the Midwest QSR landscape.
Jun 26, 2026
Discover how Cicis Pizza's rewards program skyrocketed to over one million members in under a year, driving customer engagement and retention. See the lessons for restaurant loyalty programs.
Jun 26, 2026
Darden Restaurants surpassed $13 billion in sales, fueled by robust performance at LongHorn Steakhouse and innovative menu changes at Olive Garden. Explore the strategies driving this industry giant’s continued dominance.
Jun 26, 2026
The fallout of Pizza Hut's mandated AI delivery system rollout has ignited a $100 million lawsuit from a leading franchisee, highlighting crucial franchisor-franchisee lessons for all restaurant owners.
Jun 26, 2026
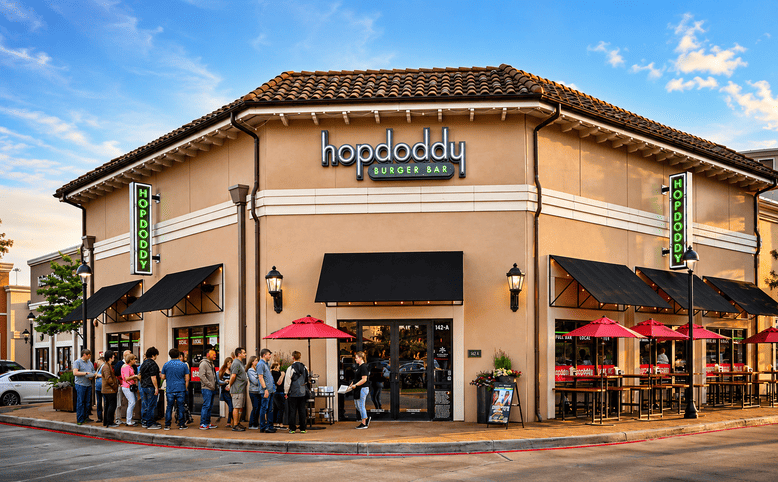
Founders Table Restaurant Group acquires fast-casual leader Hopdoddy Burger Bar, expanding its reach to over 200 restaurants and accelerating operational growth across the platform.
Jun 25, 2026
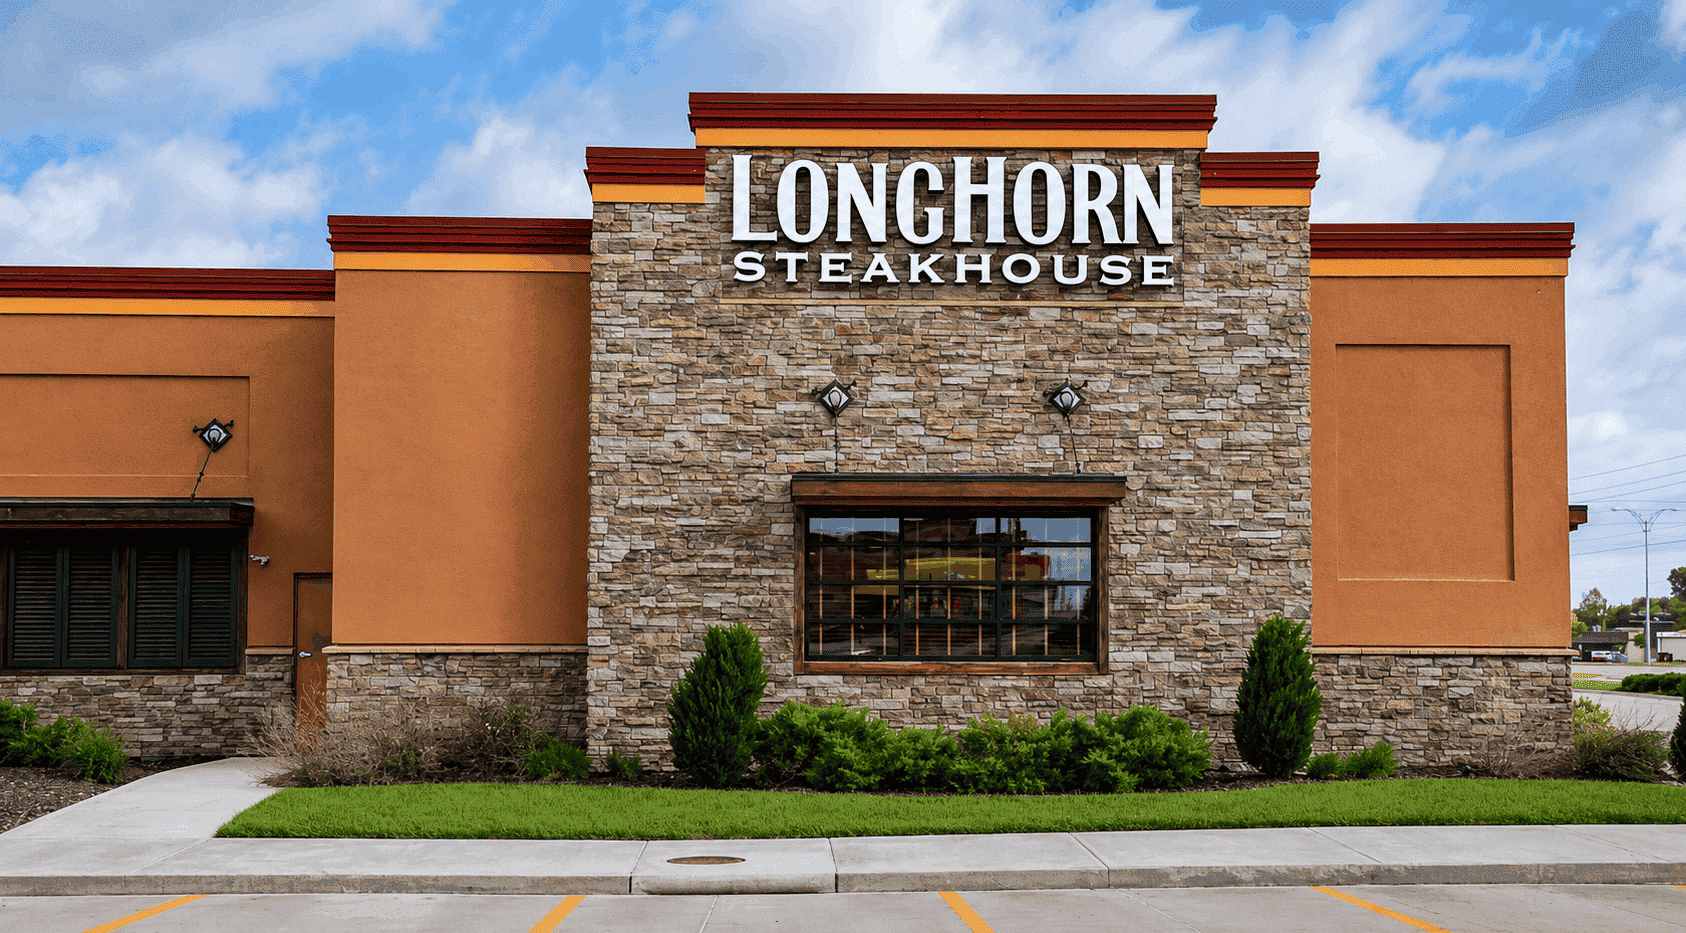
LongHorn Steakhouse surpassed $1 billion in quarterly sales for the first time, driven by strong value perception and menu innovation. Restaurant leaders can draw key lessons for thriving when consumer price sensitivity is high.
Jun 25, 2026
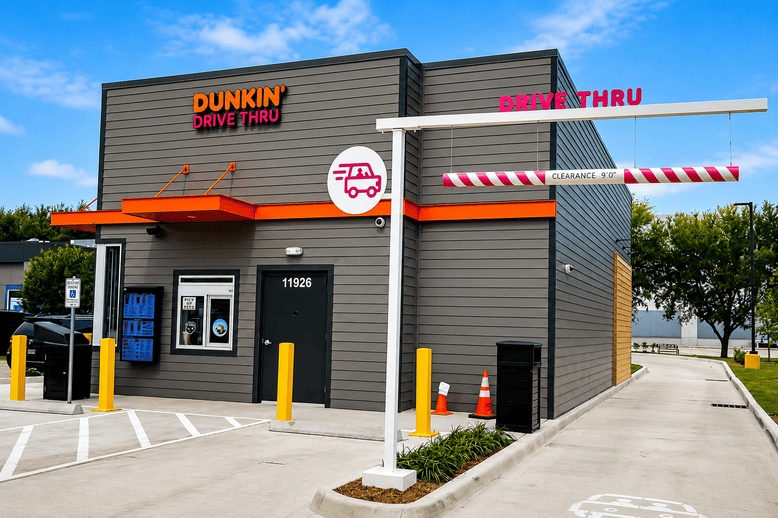
Inspire Brands is preparing for an IPO aiming for a $20B valuation. Discover how giants like Arby’s, Sonic, and Dunkin’ are performing as part of this dynamic portfolio.
Jun 25, 2026
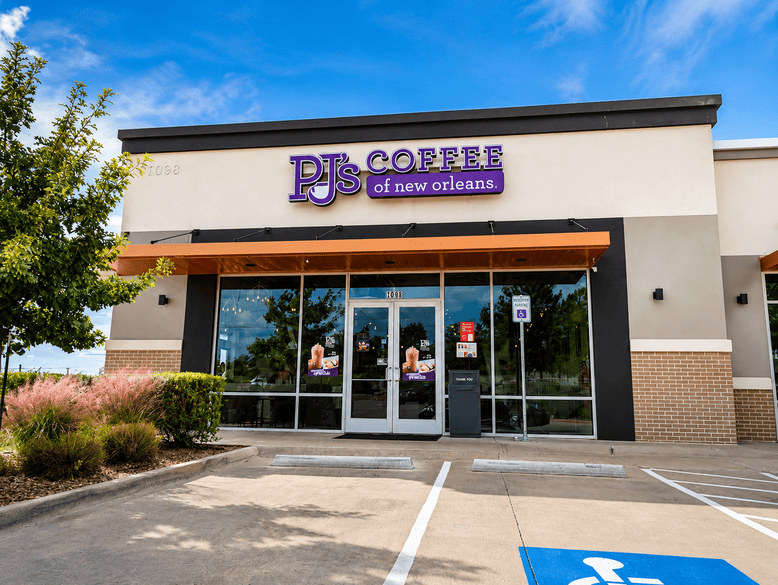
Estepp Energy, known for multi-unit brands like Little Caesars, is adding PJ's Coffee to its Kentucky convenience stores, marking a strategic expansion into specialty coffee.
Jun 24, 2026
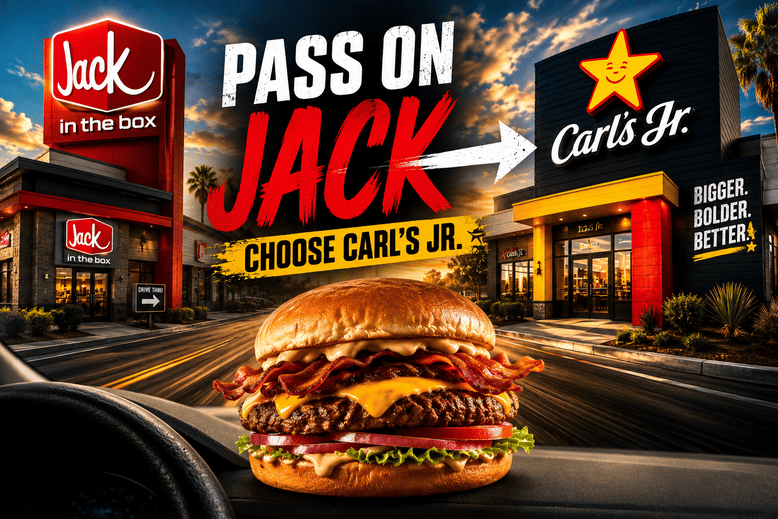
Carl's Jr. has launched a "Pass on Jack" marketing campaign rewarding loyalty members with a free Sourdough Star burger for driving past a Jack in the Box to reach a Carl's Jr. location- a direct shot at its California-based burger rival.
Jun 24, 2026

Miso Robotics has acquired Zume Pizza’s technology deck, giving new life to pizza automation and food robotics for forward-thinking restaurant operators.
Jun 24, 2026
This step-by-step guide will show restaurant owners exactly how to read their profit & loss statement, spot hidden leaks, and boost profit—no finance degree required.

You know exactly how to execute a perfect dinner rush, cook a great sauce, and calm down an unhappy VIP guest before they ever think about opening Yelp. But when the end of the month rolls around and your bookkeeper emails over a spreadsheet full of confusing abbreviations, you might feel a sudden urge to go organize the walk-in cooler instead. If checking your bank account balance is your main method of tracking your finances, you are flying blind. Cash in the bank does not equal profitability. To truly take control of your business, you need to know how to read your restaurant's profit & loss statement without an accountant holding your hand. This guide is designed for the operators in the trenches. We are going to strip away the complex financial terms and break down your P&L into simple, easy-to-digest pieces. By the end of this breakdown, you will be able to look at that spreadsheet and instantly spot where your money is flowing, where it is leaking, and exactly what changes you need to make to increase your profits.
A Profit & Loss statement (often called an Income Statement or simply a P&L) is essentially your restaurant’s health check on a piece of paper. It summarizes your sales, costs, and expenses during a specific time usually a week, a month, or a year. Many independent restaurants struggle not because of weak sales, but because of inconsistent cash flow management and delayed operational adjustments. Many independent operators make the mistake of treating the P&L as a historical document, something to file away for tax season. In reality, it is a diagnostic tool. Your accountant's job is to sort the data accurately. Your job, as the owner, is to read that data and make daily business decisions. Relying entirely on an outsider to read your numbers means you miss out on real-time fixes. If the price of your main meat dish spiked in week one, waiting for an accountant’s summary in week six means you’ve already lost money for a month and a half. Understanding this document allows you to adjust menu prices, cut Tuesday afternoon labor, or negotiate with your suppliers immediately.
Think of your P&L as a funnel. At the very top, you pour in every single dollar that enters the restaurant. As that money flows down, various costs and expenses take their cut. Whatever makes it to the very bottom is what you actually get to keep. Here is how to look at each layer of that funnel.

Even when owners start looking at their financial statements, they often fall into a few predictable traps.
Transitioning from avoiding your finances to mastering them won't happen overnight. Start building these habits- Weekly -
Running a successful kitchen is an art, but running a successful restaurant is a science. The math does not lie. Once you realize that the P&L is not a report card judging your worth, but rather a map highlighting exactly where the treasure is buried in your business, you will stop dreading it. Mastering how to read your restaurant's profit & loss statement without an accountant allows you to take ownership of your financial destiny. You don't need a degree in finance; you just need to know your Prime Costs, protect your margins, and fix the small leaks before they become floods. Ready to dive deeper into protecting your restaurant's margins? Explore more templates, operational guides, and expert advice at RestaurantAssociation.com to equip your business for long-term success.