
How to Calculate Overtime Pay for Restaurant Employees
Learn how to calculate overtime pay for restaurant employees, apply correct rates, avoid payroll mistakes, comply with labor laws, and control labor costs.
Payroll
Oct 16, 2026
Learn how to calculate overtime pay for restaurant employees, apply correct rates, avoid payroll mistakes, comply with labor laws, and control labor costs.
Oct 16, 2026

Learn how to prepare an accurate balance sheet by organizing financial records, valuing assets, recording liabilities, reconciling accounts, and preventing accounting errors.
Oct 19, 2026
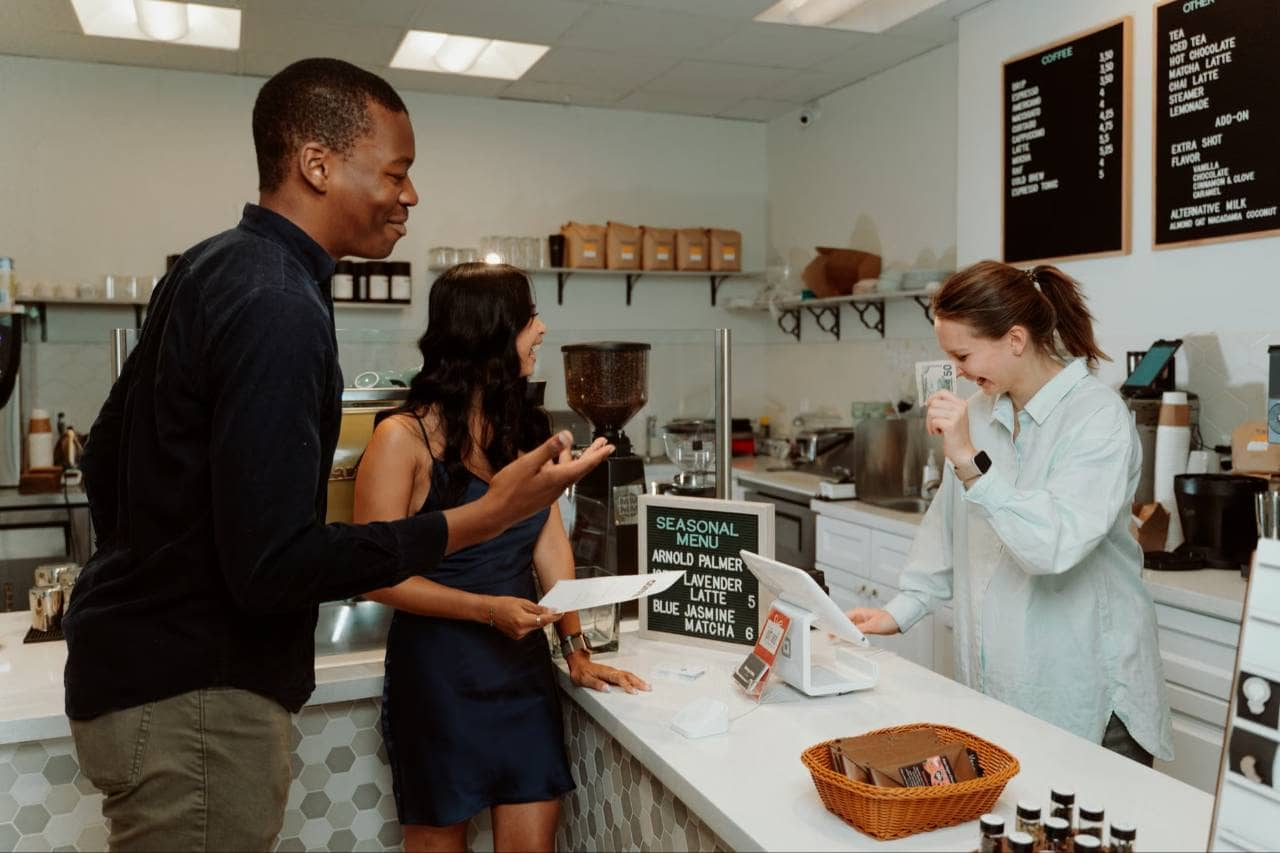
Coffee shops can boost sales by combining happy hours, bundles, limited-time drinks, seasonal menus, loyalty rewards, and friendly upselling, while tracking results and avoiding over-discounting.
Oct 19, 2026
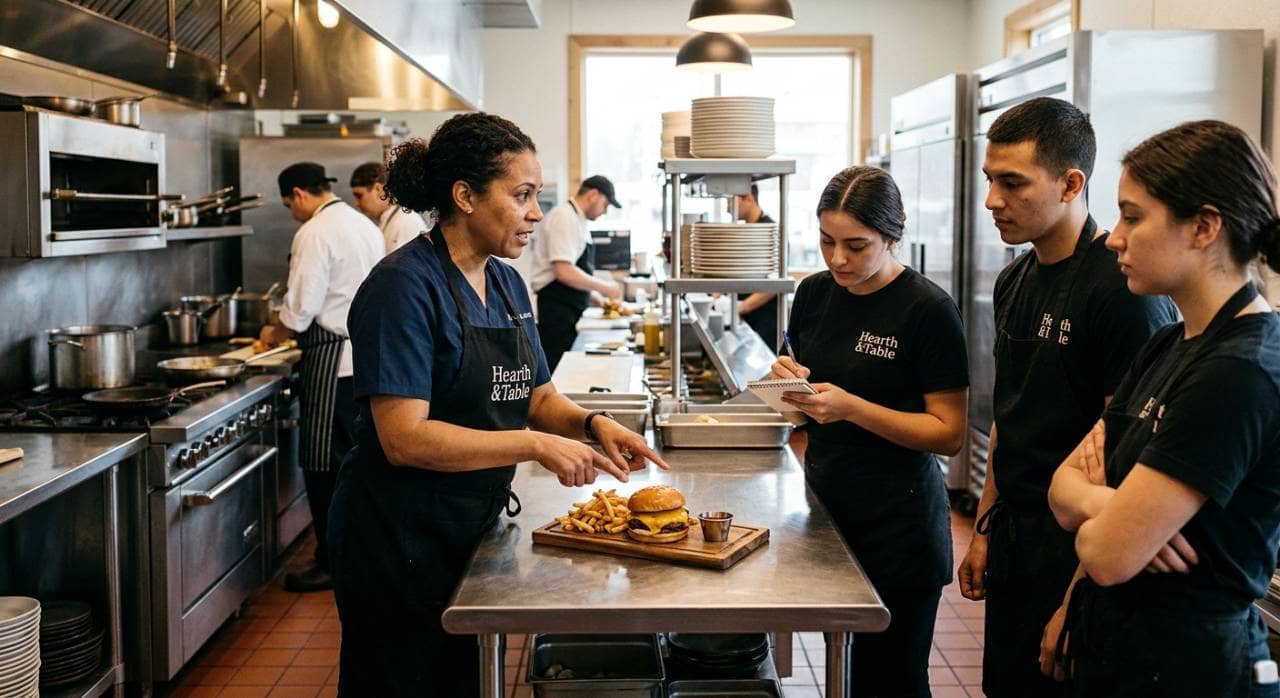
Build a structured training program covering onboarding, roles, service, food safety, and growth to boost consistency, retain staff, and deliver reliably excellent guest experiences.
Oct 16, 2026
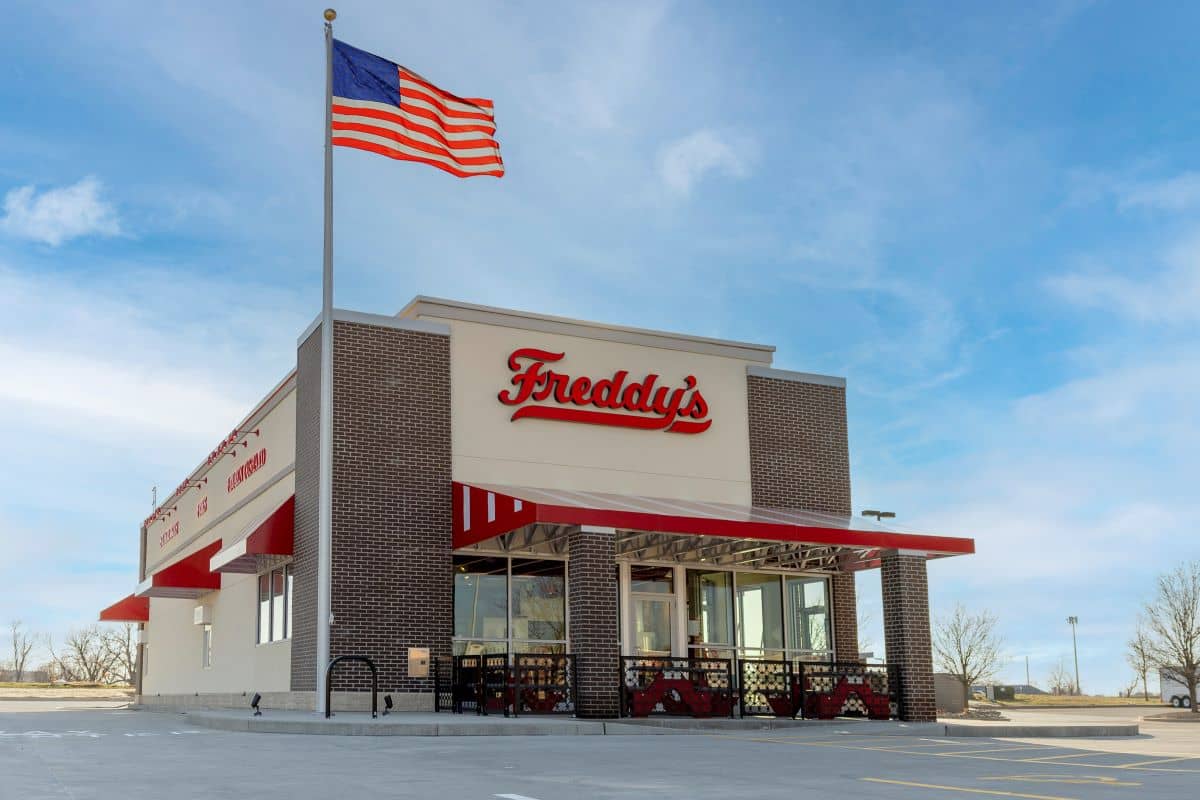
Freddy's celebrates 600 restaurants with a smaller, drive-thru-free format in Beaufort, SC, reshaping its real estate, tech, and pricing strategy.
Oct 16, 2026
Inspire Brands taps Jenna Bromberg as Arby's new CMO while Jeff Baker shifts to lead culinary innovation in a quiet leadership reshuffle.
Oct 16, 2026
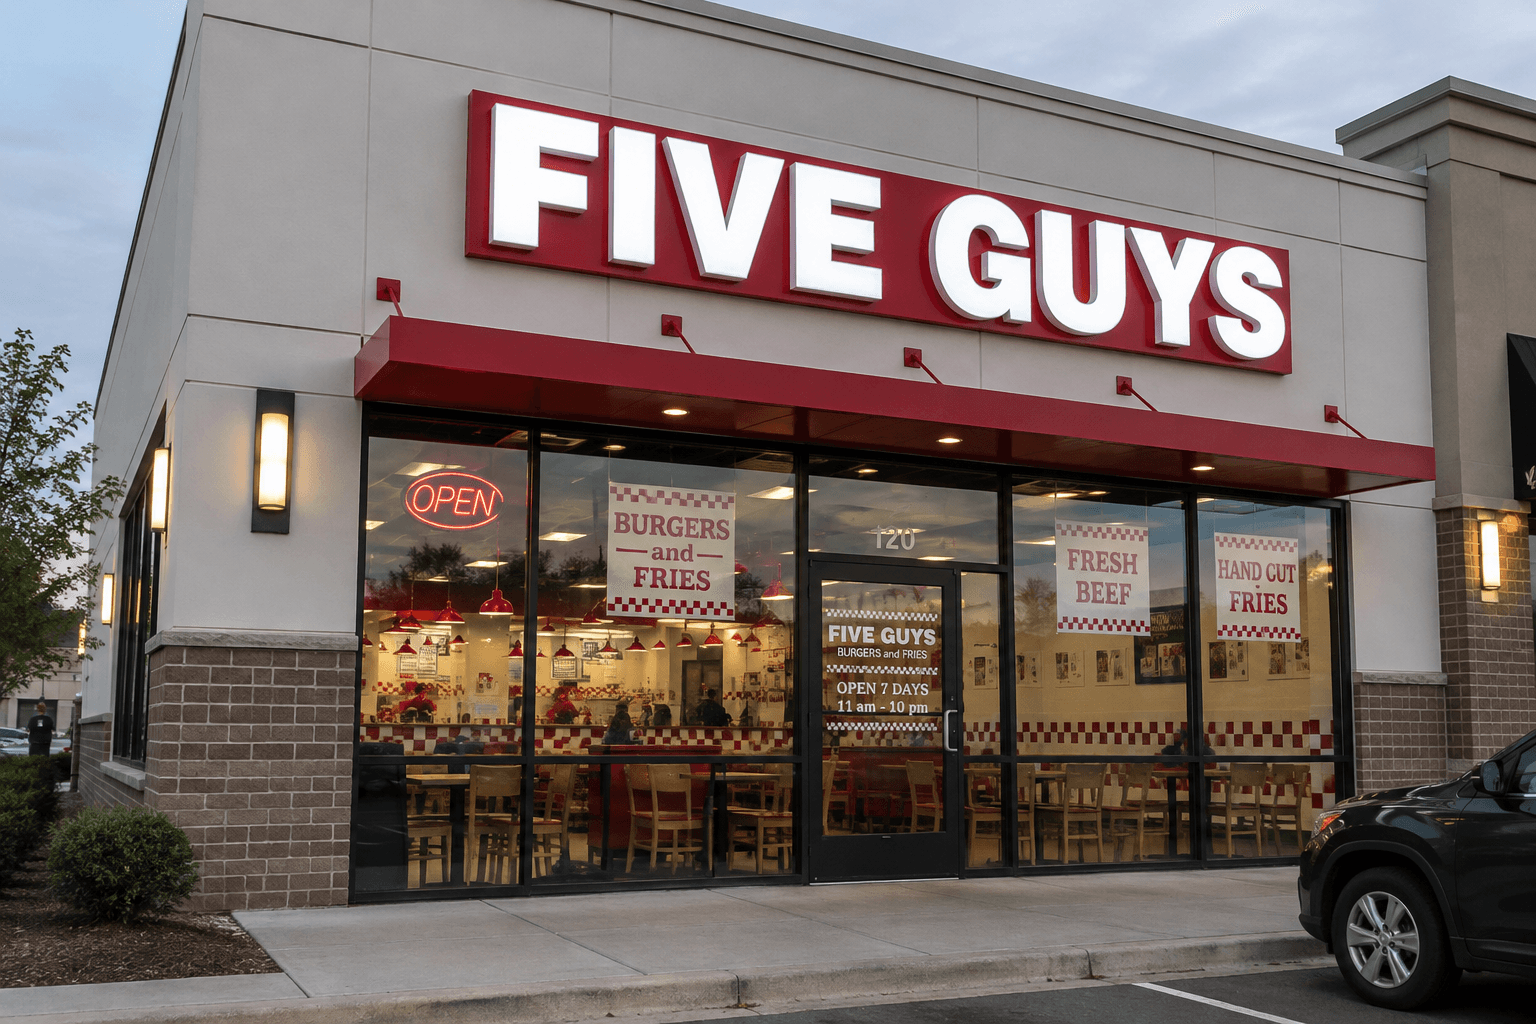
Five Guys partners with Full Day Productions and Lost Tribe Creative for On The Line, a docuseries on Prime Video following its global crew competition.
Oct 16, 2026
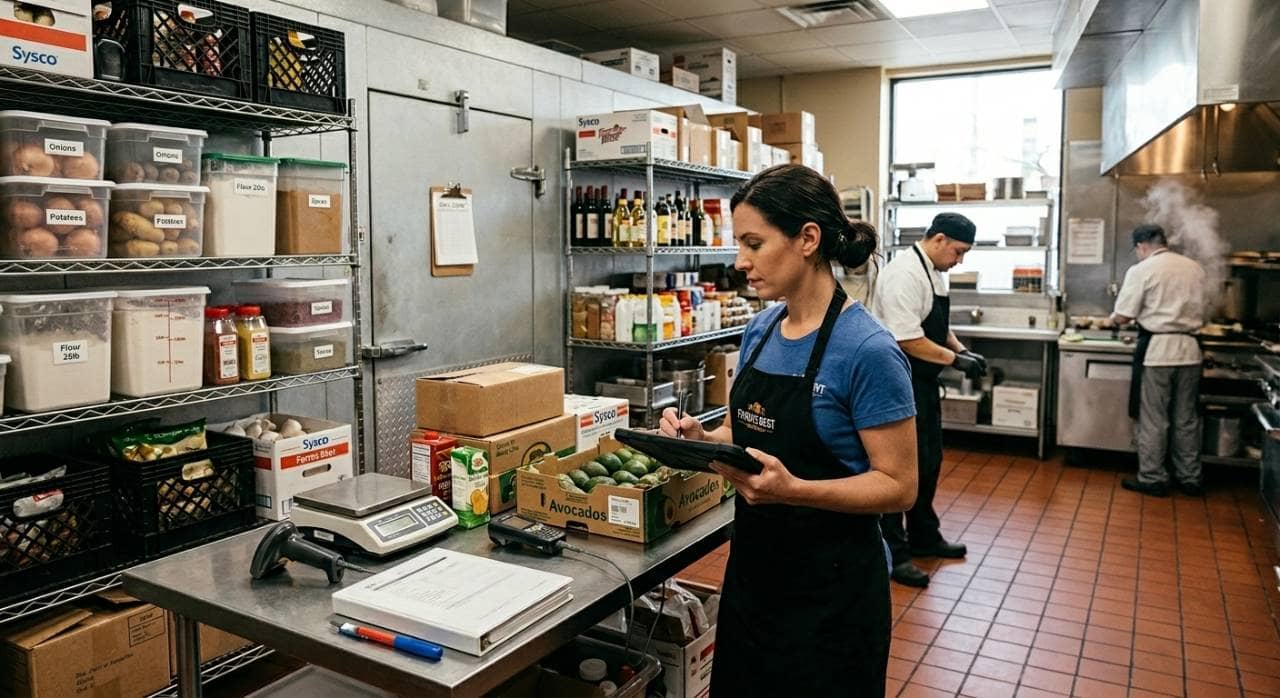
Learn how to forecast restaurant inventory using sales data, demand trends, and stock tracking to reduce food waste, control costs, and improve profitability.
Oct 14, 2026

AI helps restaurant owners streamline back-office management, automate administrative tasks, improve accuracy, control costs, and make smarter business decisions.
Oct 14, 2026

Gen Restaurant Group sells all 47 Gen Korean BBQ locations to Chubby Cattle Group for $100 million, keeping its brand and CPG business.
Oct 14, 2026

Unlock Exclusive Access To Webinars, Events, And The Latest News For Free!
Understand how to calculate labor cost percentage using payroll and sales data while improving scheduling, efficiency, budgeting, and restaurant profitability.

Labor cost percentage is a restaurant metric that shows how much of a restaurant's sales revenue goes toward labor. It helps owners understand whether staffing expenses are in line with the revenue the business generates and whether labor is managed efficiently. Labor costs often include more than hourly wages. Depending on the restaurant's accounting method, they may also include salaries, overtime pay, payroll taxes, bonuses, employee benefits, and other payroll-related expenses. Comparing these costs with restaurant sales gives owners a picture of how labor affects profitability. When labor expenses rise while sales stay flat or decline, labor cost percentage increases. This can point to overstaffing, excessive overtime, inefficient scheduling, or weaker sales. A lower percentage may suggest labor efficiency, but cutting staff too aggressively can lead to slower service, employee burnout, and a poorer guest experience. Restaurant owners should use labor cost percentage as a management tool, not simply aim for the lowest number possible. Tracking it consistently helps identify trends, compare periods, and improve scheduling decisions. For accurate calculations, labor costs and sales must cover the same reporting period. Using consistent data gives owners a reliable view of labor performance and helps manage one of their largest operating expenses.
Before calculating labor cost percentage, restaurant owners need to identify every expense connected to employing their workforce. Using only hourly wages can underestimate the true cost of labor and produce an inaccurate percentage. A complete labor cost calculation may include the following categories - 1. Hourly Wages - Include regular wages paid to hourly employees such as servers, cooks, hosts, bartenders, dishwashers, and other team members. 2. Salaried Employees - Add salaries paid to general managers, assistant managers, kitchen managers, chefs, and other salaried staff included in restaurant operations. 3. Overtime Pay - Track overtime separately because it can increase labor expenses quickly when employees consistently work beyond their regular schedules. 4. Payroll Taxes - Employer-paid payroll taxes should be included when calculating the full cost of employing restaurant staff. 5. Employee Benefits - Depending on the restaurant, labor expenses may also include health insurance contributions, retirement contributions, paid time off, and other employer-funded benefits. 6. Bonuses and Incentives - Performance bonuses, hiring incentives, referral bonuses, and other employee rewards can also contribute to total labor costs. For example, consider a restaurant with the following weekly labor expenses - - Hourly wages. $9,000 - Salaried management. $2,500 - Overtime. $800 - Payroll taxes. $1,200 - Benefits and other labor expenses. $500 In this example, the restaurant's total weekly labor cost would be $14,000. Restaurant owners should use the same labor cost categories every time they calculate their percentage. Consistency makes it easier to compare one week or month with another and identify where labor expenses are increasing. It can also be useful to separate labor costs by department. Tracking front-of-house, back-of-house, and management labor individually can help owners determine which parts of the operation are driving labor spending and where staffing adjustments may be needed.
Once all labor-related expenses have been identified, the next step is to calculate the restaurant's total labor cost for a specific reporting period. This number becomes the first part of the labor cost percentage calculation. Restaurant owners can measure labor costs daily, weekly, biweekly, or monthly. The key is to use the same time period for both labor expenses and restaurant sales. For example, a restaurant may record the following labor expenses for one month - - Hourly employee wages. $32,000 - Salaried management. $10,000 - Overtime pay. $2,500 - Employer payroll taxes. $4,000 - Employee benefits. $2,000 - Bonuses and incentives. $1,000 The restaurant's total monthly labor cost would be - $32,000 + $10,000 + $2,500 + $4,000 + $2,000 + $1,000 = $51,500 This means the restaurant spent $51,500 on labor during that month. Breaking labor costs into categories also helps owners see where expenses are changing. For example, if overtime increases from $1,000 to $2,500 in one month, the restaurant has added $1,500 in additional labor expense before considering changes in sales. That increase may be caused by employee shortages, scheduling gaps, unexpected absences, or employees consistently working beyond scheduled hours. Restaurant owners should also compare actual labor costs with their planned labor budget. If the monthly labor budget is $48,000 but actual labor spending reaches $51,500, the restaurant is $3,500 over budget. Tracking these differences regularly allows owners to identify cost increases before they become larger problems. Accurate labor cost totals also create a stronger foundation for calculating labor cost percentage, measuring staffing efficiency, and making informed scheduling decisions based on actual restaurant performance.

After calculating total labor costs, restaurant owners need to determine the restaurant's total sales for the same reporting period. Sales serve as the comparison point used to calculate labor cost percentage. The most important rule is consistency. If labor costs are measured weekly, sales should also be measured weekly. If labor costs cover an entire month, the sales figure should cover that same month. For example, assume a restaurant reports the following weekly sales - - Monday. $4,500 - Tuesday. $5,000 - Wednesday. $5,500 - Thursday. $6,000 - Friday. $9,000 - Saturday. $11,000 - Sunday. $7,000 Total weekly restaurant sales would equal - $4,500 + $5,000 + $5,500 + $6,000 + $9,000 + $11,000 + $7,000 = $48,000 If the restaurant spent $14,000 on labor during that same week, the owner now has the two numbers needed to calculate labor cost percentage, $14,000 in labor costs and $48,000 in sales. Sales fluctuations can have a major impact on labor cost percentage. For example, imagine that labor costs remain at $14,000, but weekly sales decrease from $48,000 to $40,000. Even though payroll spending has not changed, labor will represent a larger share of restaurant revenue. This is why restaurant owners should evaluate labor spending alongside sales performance rather than looking at payroll dollars alone. Owners should also use a consistent definition of sales when tracking this metric. Depending on the restaurant's accounting practices, this may involve using net sales after discounts, refunds, and certain adjustments. The same calculation method should be applied consistently from one reporting period to the next. Accurate sales data helps restaurant owners understand whether changes in labor cost percentage are being driven by higher payroll expenses, lower sales, or a combination of both. This creates a clearer foundation for making staffing and scheduling decisions.
Once restaurant owners know their total labor costs and total sales for the same reporting period, they can calculate labor cost percentage using a simple formula - Labor Cost Percentage = (Total Labor Cost / Total Restaurant Sales) x 100 For example, assume a restaurant records - - Total weekly labor cost. $14,000 - Total weekly restaurant sales. $48,000 The calculation would be - $14,000 / $48,000 = 0.2917 Then multiply the result by 100 - 0.2917 x 100 = 29.17% The restaurant's labor cost percentage for that week is approximately 29.2%. This means that for every $100 in restaurant sales, about $29.20 is being spent on labor. Restaurant owners can apply the same formula to different reporting periods - 1. Daily labor cost / daily sales 2. Weekly labor cost / weekly sales 3. Monthly labor cost / monthly sales 4. Annual labor cost / annual sales The reporting period matters because short-term changes can affect the percentage significantly. For example, consider a restaurant spending $10,000 per week on labor - - At $40,000 in weekly sales, labor cost percentage is 25% - At $35,000 in weekly sales, it increases to approximately 28.6% - At $30,000 in weekly sales, it rises to approximately 33.3% In this example, labor spending never changes. The percentage increases because restaurant sales decline. This is why owners should analyze both sides of the calculation. A rising labor cost percentage may result from higher wages, overtime, overstaffing, or declining sales. Calculating labor cost percentage consistently allows restaurant owners to spot these changes quickly and understand whether labor expenses are growing faster than revenue. The metric can then support more informed decisions about scheduling, staffing levels, overtime, and overall labor budgeting.
A practical example can help restaurant owners see how labor cost percentage works when multiple payroll expenses are included. Assume a restaurant records the following labor expenses for one month - 1. Hourly wages. $28,000 2. Salaried managers. $9,000 3. Overtime pay. $2,000 4. Payroll taxes. $3,500 5. Employee benefits. $1,500 6. Bonuses and other labor expenses. $1,000 The restaurant's total monthly labor cost is - $28,000 + $9,000 + $2,000 + $3,500 + $1,500 + $1,000 = $45,000 During the same month, the restaurant generates $150,000 in total sales. Using the labor cost percentage formula - ($45,000 / $150,000) x 100 = 30% The restaurant's labor cost percentage is 30%. This means that for every $100 in sales, the restaurant spends $30 on labor-related expenses. Now consider what happens when sales change but labor costs remain the same - - At $150,000 in sales, labor cost percentage is 30% - At $135,000 in sales, labor cost percentage rises to approximately 33.3% - At $120,000 in sales, labor cost percentage increases to 37.5% This comparison shows why restaurant owners should not evaluate labor spending based only on payroll dollars. Even when labor expenses remain unchanged at $45,000, declining sales can push the labor cost percentage significantly higher. The same principle applies when labor costs rise. If monthly sales remain at $150,000 but labor costs increase from $45,000 to $50,000, the labor cost percentage increases from 30% to approximately 33.3%. By running these calculations regularly, restaurant owners can identify whether changes in labor cost percentage are primarily caused by payroll increases, sales declines, or both. This makes the metric more useful for scheduling, budgeting, forecasting, and controlling overall restaurant labor expenses.

Calculating labor cost percentage once provides a snapshot, but tracking it consistently gives restaurant owners a clearer view of how staffing costs change over time. Daily, weekly, and monthly comparisons can reveal patterns that are difficult to see from payroll totals alone. For example, consider a restaurant with the following four-week results - Week 1 - Labor cost $12,000, sales $40,000, labor cost percentage 30% Week 2 - Labor cost $12,500, sales $42,000, labor cost percentage 29.8% Week 3 - Labor cost $13,500, sales $40,000, labor cost percentage 33.8% Week 4 - Labor cost $14,000, sales $38,000, labor cost percentage 36.8% The data shows a clear upward trend. Between Week 1 and Week 4, labor spending increases by $2,000, while sales decline by $2,000. As a result, labor cost percentage rises from 30% to 36.8%, an increase of 6.8 percentage points. Owners can investigate the reasons behind this change by reviewing additional labor data, including - - Total labor hours scheduled - Overtime hours - Sales per labor hour - Employee callouts - Shift coverage changes - Labor cost by department - Actual labor versus budgeted labor Tracking labor cost percentage by day can also reveal inefficient staffing periods. For example, a restaurant may record a 24% labor cost percentage on Friday but 38% on Monday. The difference may indicate that Monday staffing levels are too high relative to sales volume. Restaurant owners should compare labor cost percentage across consistent reporting periods and alongside sales trends. A single high week may result from a temporary event, but several consecutive increases may signal a larger scheduling or productivity issue. By monitoring labor cost percentage over time, owners can identify cost trends earlier, adjust staffing levels based on demand, manage overtime, and make more informed labor decisions before higher expenses significantly affect restaurant profitability.
Once restaurant owners begin tracking labor cost percentage, the next step is using the data to improve scheduling and control labor expenses without reducing service quality. The goal is not simply to cut payroll. Instead, owners should focus on matching labor hours with expected customer demand and restaurant sales. For example, assume a restaurant generates $50,000 in weekly sales and spends $17,500 on labor. Its labor cost percentage is - ($17,500 / $50,000) x 100 = 35% If the restaurant reduces unnecessary overtime and improves scheduling, weekly labor costs may fall to $15,500 while sales remain at $50,000. The new labor cost percentage becomes - ($15,500 / $50,000) x 100 = 31% That represents a reduction of 4 percentage points and $2,000 in weekly labor expenses. Restaurant owners can improve labor cost performance by focusing on several areas - 1. Schedule Based on Sales Forecasts - Compare projected sales with scheduled labor hours. Higher-volume shifts may require more employees, while slower periods may need smaller teams. 2. Monitor Overtime - If five employees each work five overtime hours per week, the restaurant is accumulating 25 overtime hours. Tracking these hours can reveal scheduling gaps that may be preventable. 3. Measure Sales Per Labor Hour - Dividing restaurant sales by total labor hours helps owners evaluate workforce productivity. If sales increase while labor hours remain stable, labor efficiency generally improves. 4. Cross-Train Employees - Employees who can perform multiple roles may help restaurants adjust staffing more easily when demand changes or employees call out. 5. Compare Actual Labor With Budget - If the weekly labor budget is $15,000 but actual labor reaches $17,500, the restaurant is $2,500 over budget. Reviewing this variance quickly allows managers to identify the cause. Restaurant owners should review labor cost percentage together with sales, labor hours, overtime, and service performance. Using these metrics together helps create a balanced approach that controls labor spending while maintaining enough staff to deliver consistent food quality and customer service.