How to Calculate Cost of Goods Sold for a Restaurant
Learn how to calculate restaurant cost of goods using inventory, purchases, COGS percentage, variance reviews, and regular tracking for profitability.
Aug 31, 2026
Learn how to calculate restaurant cost of goods using inventory, purchases, COGS percentage, variance reviews, and regular tracking for profitability.
Aug 31, 2026
Understand how to evaluate a Kiosk system using key criteria including features, POS integration, hardware, pricing, customer experience, and support.
Aug 31, 2026
Explore restaurant technology trends in 2026, including AI, automation, digital ordering, workforce tools, connected kitchens, personalization, and profitability strategies today.
Aug 28, 2026
Learn the startup costs of opening an ice cream shop, including rent, equipment, renovations, permits, inventory, labor, marketing, and reserves.
Aug 28, 2026
Learn practical ways to reduce labour costs through smarter scheduling, forecasting, productivity, cross-training, automation, overtime control, and performance monitoring strategies.
Aug 26, 2026
A restaurant P&L statement reveals sales, expenses, and profits, helping owners manage costs, improve margins, and plan finances more effectively.
Aug 26, 2026
RaceTrac has appointed Jill Pemberton as chief financial officer, succeeding Karla Ahlert, who moves into the newly created role of chief administrative officer.
Aug 26, 2026
Levain Bakery appoints Lorna Sommerville and Taya Stenson as co-CEOs, blending operational and marketing expertise to power national expansion and innovation while staying rooted in its brand values.
Aug 25, 2026
Create a practical restaurant marketing plan by setting goals, targeting customers, choosing channels, budgeting wisely, scheduling campaigns, and measuring results.
Aug 24, 2026
A payroll advance policy helps restaurant owners define eligibility, limits, repayment, documentation, approval procedures, and compliance requirements for employee advances.
Aug 24, 2026
Unlock Exclusive Access To Webinars, Events, And The Latest News For Free!
Learn how to calculate restaurant cost of goods using inventory, purchases, COGS percentage, variance reviews, and regular tracking for profitability.

Cost of goods sold, or COGS, represents the direct cost of the food, beverages, and other inventory items a restaurant uses to generate sales during a specific period. Tracking COGS helps restaurant owners understand how much they are spending on the products they sell and how those costs affect gross profit. For most restaurants, COGS primarily includes the cost of - - Food ingredients used to prepare menu items - Alcoholic and nonalcoholic beverages - Condiments and garnishes - Takeout packaging when it is directly tied to the sale of food - Other consumable inventory items directly associated with producing menu items COGS generally does not include operating expenses such as employee wages, rent, utilities, marketing, insurance, or administrative costs. Those expenses are tracked separately on the restaurant's profit and loss statement. Restaurant COGS is based on the inventory actually used during the period, not simply the amount of inventory purchased. For example, buying $10,000 worth of food during a month does not automatically mean your COGS is $10,000. Some of that inventory may still be sitting in your walk-in cooler, freezer, or storage area at the end of the month. That is why restaurant owners typically calculate COGS using three figures - Beginning Inventory + Purchases - Ending Inventory = Cost of Goods Sold If a restaurant starts the month with $8,000 in inventory, purchases another $25,000, and ends with $7,000 remaining, its COGS would be - $8,000 + $25,000 - $7,000 = $26,000 Understanding this distinction gives restaurant owners a more accurate picture of how much product was actually consumed to generate sales. Regular COGS tracking can also help identify rising ingredient costs, excessive waste, inaccurate portioning, purchasing problems, and inventory discrepancies before they significantly reduce profit margins.
The next step in calculating restaurant COGS is determining your beginning inventory. Beginning inventory is the total value of the food, beverages, and other qualifying inventory you have on hand at the start of the accounting period. For example, if you calculate COGS weekly, your beginning inventory is the value of everything in stock at the start of the week. If you calculate COGS monthly, it is the inventory value at the beginning of the month. To calculate beginning inventory accurately, count all relevant products in storage areas such as - - Walk-in coolers and freezers - Dry storage areas - Bar and beverage storage - Prep stations - Refrigerators and kitchen storage - Back-stock and receiving areas Record the quantity of each item and multiply it by its current unit cost. For example, if you have 10 pounds of chicken valued at $3 per pound, that inventory is worth $30. Use the following formula for each item - Quantity on Hand x Unit Cost = Inventory Value Once every item has been counted and valued, add the amounts together to determine your total beginning inventory. It is important to use a consistent inventory counting process. Count inventory at approximately the same time each period, preferably when the restaurant is closed or activity is low. This reduces the chance that incoming deliveries or food being used during service will distort your numbers. Your beginning inventory should also match the ending inventory from the previous accounting period. For example, if last week's ending inventory was $7,500, this week's beginning inventory should also be $7,500. Accurate beginning inventory creates the foundation for a reliable COGS calculation. If this number is incorrect, your final COGS figure will also be inaccurate, making it harder to evaluate food costs and restaurant profitability.

After determining beginning inventory, calculate the total value of inventory purchases made during the accounting period. This includes the food, beverages, and other qualifying items your restaurant bought to replenish stock and support sales. Start by reviewing supplier invoices, purchase orders, delivery records, and accounting records for the period. Add together all purchases that are directly related to the products your restaurant sells. Inventory purchases may include - - Meat, seafood, produce, dairy, and dry goods - Alcoholic and nonalcoholic beverages - Cooking oils, sauces, spices, and condiments - Ingredients used in preparation and recipes - Takeout packaging, if you include it in COGS - Other consumable products directly tied to food or beverage sales Be careful not to include unrelated operating expenses. Equipment repairs, cleaning supplies, office supplies, rent, payroll, and utilities should generally be recorded separately rather than included in restaurant COGS. For example, suppose your restaurant purchases the following during one month - - Food ingredients ($18,000) - Beverages ($5,000) - Takeout packaging ($1,500) - Condiments and garnishes ($500) Your total qualifying purchases would be - $18,000 + $5,000 + $1,500 + $500 = $25,000 Accuracy is especially important when recording purchases. Missing invoices, duplicate entries, credits, returns, or supplier adjustments can distort your COGS calculation. Restaurant owners should also use a consistent accounting method when recording purchases. Make sure every supplier invoice is entered into the correct accounting period and categorized consistently. Once you have your total purchases, you can combine this amount with beginning inventory and, later, subtract ending inventory to determine how much inventory was actually used during the period.
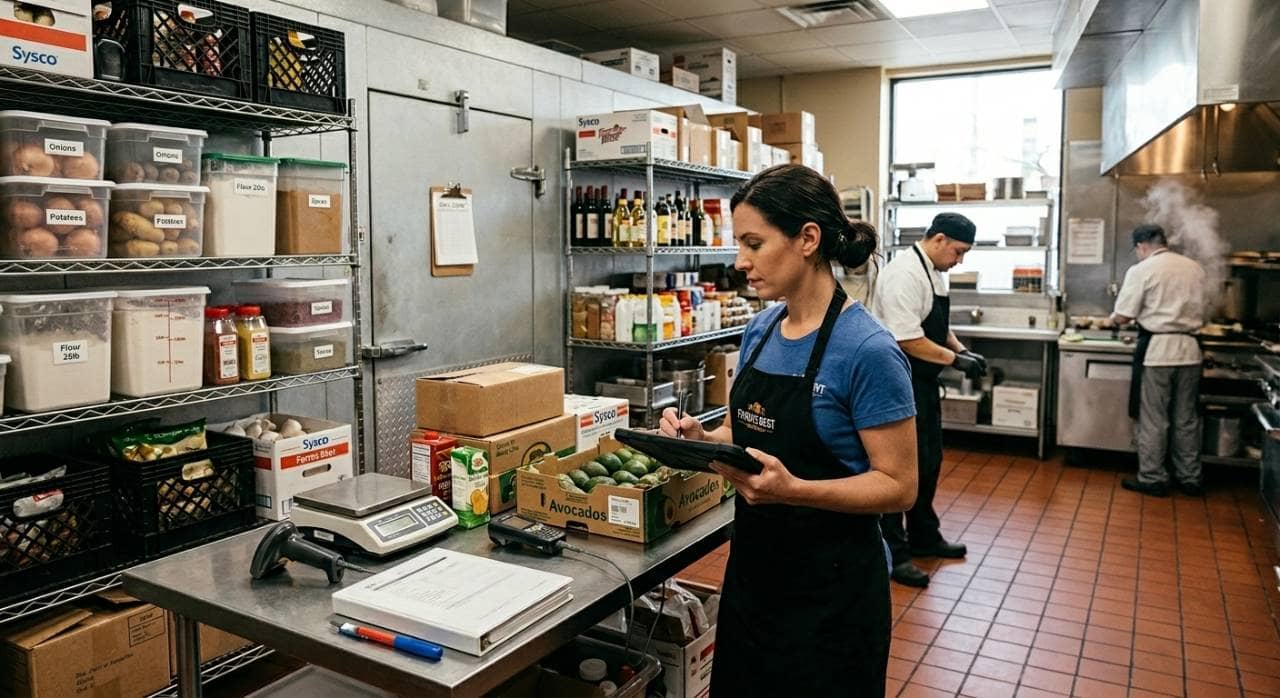
The next step is to calculate your ending inventory, which is the total value of food, beverages, and other qualifying inventory still on hand at the end of the accounting period. Ending inventory is important because COGS measures what your restaurant actually used, not everything it purchased. Any products still sitting in storage at the end of the period must be subtracted from the COGS calculation. To determine ending inventory, conduct a physical inventory count in the same areas you used for beginning inventory, including - - Walk-in refrigerators and freezers - Dry storage areas - Bar and beverage storage - Prep stations - Kitchen refrigerators - Back-stock areas For each item, record the quantity remaining and multiply it by the unit cost. Use this formula - Quantity on Hand x Unit Cost = Ending Inventory Value For example, if your restaurant has 20 pounds of ground beef remaining at a cost of $4 per pound, the inventory value would be - 20 x $4 = $80 Repeat this process for every inventory item, then add the values together to determine your total ending inventory. For the most accurate results, count inventory at the same time and under similar conditions each period. Many restaurants complete inventory counts after closing or before opening so that deliveries, food preparation, and sales do not change quantities during the count. You should also use consistent units of measurement. If one employee records chicken by the case while another records it by the pound, inventory values can become inaccurate. Standardize units such as pounds, ounces, cases, bottles, or individual units across your inventory records. For example, if your restaurant began the month with $8,000 in inventory, purchased $25,000, and finished with $7,000 in inventory, the $7,000 becomes your ending inventory. That amount will be subtracted in the COGS formula because those products have not yet been used to generate sales. Accurate ending inventory helps ensure your COGS reflects the true cost of inventory consumed during the period.
Once you have your beginning inventory, purchases, and ending inventory, you can calculate your restaurant's cost of goods sold using a simple formula - Beginning Inventory + Purchases - Ending Inventory = COGS Each part of the formula serves a specific purpose - - Beginning inventory is the value of inventory you had at the start of the period. - Purchases are the additional food, beverages, and other qualifying inventory bought during the period. - Ending inventory is the value of inventory still remaining at the end of the period. For example, assume your restaurant has - Beginning inventory ($8,000) Purchases ($25,000) Ending inventory ($7,000) Your calculation would be - $8,000 + $25,000 - $7,000 = $26,000 Your restaurant's COGS for the period is therefore $26,000. This means your restaurant used $26,000 worth of inventory to generate sales during that accounting period. The formula accounts for both products already in stock and new purchases while removing inventory that remains unused. Restaurant owners can calculate COGS weekly, monthly, or for another consistent accounting period. More frequent calculations can make it easier to spot sudden increases in food costs, inventory shortages, waste, or purchasing problems. Consistency is important. Use the same inventory valuation method, accounting period, and counting procedures each time you calculate COGS. Changing methods from one period to another can make comparisons less reliable. Once you know your total COGS, the next step is to compare it with restaurant sales. This helps you calculate your COGS percentage, which provides a clearer view of how much of your revenue is being consumed by food and beverage costs.

After calculating total cost of goods sold, convert that figure into a COGS percentage. This shows how much of your restaurant's sales revenue is being used to cover the cost of food, beverages, and other qualifying inventory. Use the following formula - COGS / Sales x 100 = COGS Percentage For example, if your restaurant has - COGS ($26,000) Sales ($80,000) Your calculation would be - $26,000 / $80,000 x 100 = 32.5% This means 32.5% of your sales revenue went toward the cost of goods sold during that period. COGS percentage is useful because it allows you to compare cost performance across different periods, even when sales volumes change. A restaurant might have higher total COGS during a busy month, but the percentage can still remain stable if sales increase at a similar rate. Restaurant owners can also calculate COGS percentages by category, such as - - Food COGS percentage - Beer COGS percentage - Wine COGS percentage - Liquor COGS percentage - Nonalcoholic beverage COGS percentage Breaking COGS down by category can make it easier to identify where costs are increasing. For example, if your overall COGS percentage rises from 30% to 35%, the increase could be caused by higher supplier prices, larger portions, excessive waste, theft, inaccurate inventory counts, or menu prices that have not kept pace with ingredient costs. Rather than relying on one universal target, compare your COGS percentage against your restaurant's historical performance, budget, menu mix, and pricing strategy. Tracking this percentage consistently gives you a clearer view of whether product costs are staying under control and how they are affecting gross profit.
After calculating COGS, review the result for unusual changes or discrepancies. A sudden increase or decrease does not always mean your restaurant actually used more or less inventory. Sometimes the difference comes from counting errors, missing invoices, incorrect unit costs, or inconsistent recordkeeping. Start by comparing your current COGS and COGS percentage with previous weeks or months. If your COGS percentage normally stays near 30% but suddenly rises to 36%, investigate what changed. Common causes of COGS variances include - - Incorrect inventory counts caused by missed items or counting the same product twice - Missing supplier invoices that cause purchases to be understated - Duplicate invoices that make purchases appear higher than they actually were - Supplier credits or returns that were not recorded - Incorrect unit costs used when valuing inventory - Food waste or spoilage that was not properly documented - Overportioning that increases ingredient usage - Theft or unrecorded consumption - Recipe inconsistencies that cause actual ingredient usage to exceed expected amounts For example, suppose your restaurant normally reports a COGS percentage of 31%, but this month it reaches 35%. Before assuming food costs have permanently increased, check whether inventory was counted correctly and whether all purchases, credits, and waste were recorded. You can also compare actual COGS with expected or theoretical food costs based on recipes and sales. A large gap between the two may indicate waste, portion-control problems, inventory shrinkage, or inaccurate recipe costs. Documenting the reason for major variances makes COGS tracking more useful over time. Instead of simply seeing that costs increased, you can identify whether the cause was supplier pricing, operational inefficiency, inventory errors, or another factor. Regular COGS reviews help restaurant owners catch problems early and make more informed decisions about purchasing, portion sizes, menu pricing, waste control, and inventory management.
Calculating COGS once is useful, but tracking it consistently gives restaurant owners a much clearer picture of how food and beverage costs are changing over time. Regular monitoring can help you identify problems before they significantly affect profitability. Many restaurants review COGS on a weekly or monthly basis. Weekly tracking can provide faster visibility into sudden cost increases, while monthly tracking is useful for financial reporting and longer-term trend analysis. When reviewing COGS, compare - - Current COGS with previous periods - Actual COGS with budgeted COGS - COGS percentage with your target percentage - Food and beverage categories separately - Inventory usage with sales volume - Supplier prices with previous purchase costs For example, if your COGS percentage increases from 30% to 34%, investigate the change rather than simply accepting the higher cost. The increase could be caused by higher ingredient prices, excessive waste, inaccurate portions, poor purchasing decisions, or lower menu prices relative to ingredient costs. Tracking COGS by category can provide even more useful information. Food costs may be increasing while beverage costs remain stable, allowing you to focus your attention on the area creating the problem. You should also establish a consistent schedule for inventory counts, invoice entry, waste tracking, and COGS calculations. Using the same process each period makes your numbers easier to compare and reduces the risk of inaccurate reporting. Over time, COGS data can support better decisions around menu pricing, recipe costing, supplier negotiations, purchasing, portion control, and inventory levels. If ingredient costs increase, for example, you can determine whether to adjust menu prices, change suppliers, modify recipes, or reduce waste. The goal is not simply to calculate COGS. It is to use the information to understand where your money is going and take action when costs begin moving in the wrong direction. Consistent COGS tracking gives restaurant owners greater control over food costs and helps protect gross profit margins.