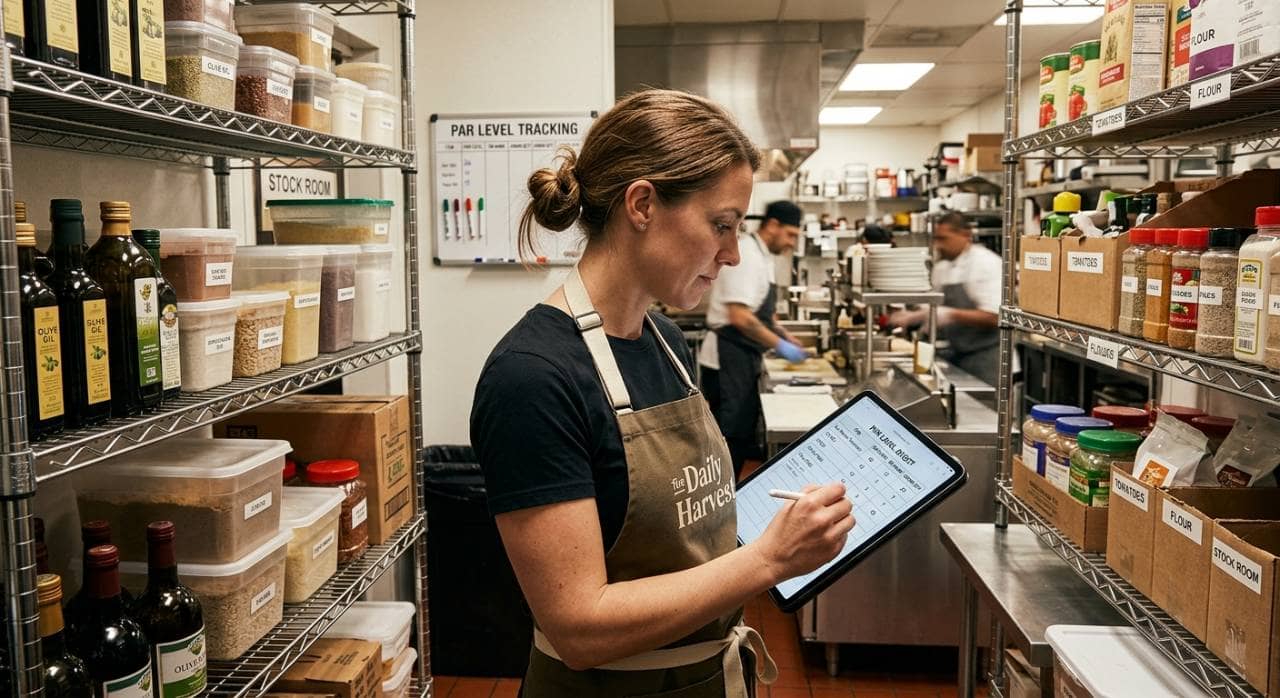
How to Set Par Levels for Restaurant Inventory
Learn to calculate par levels for restaurant food, beverages, and packaging inventory, preventing stockouts and waste through proper formulas.
Back Office
Sep 4, 2026
Learn to calculate par levels for restaurant food, beverages, and packaging inventory, preventing stockouts and waste through proper formulas.
Sep 4, 2026
Caribou Coffee appoints Zane Thomas-Rogers as Chief Operations Officer to strengthen execution across its expanding coffeehouse network.
Sep 4, 2026

Compare the top 10 restaurant POS systems in the USA for 2026. Explore features, pricing, pros, cons, and the best POS options for every restaurant type.
Jul 1, 2026

Learn how to handle restaurant payroll yourself, from calculating hours and wages to managing tips, taxes, and final paychecks.
Sep 2, 2026
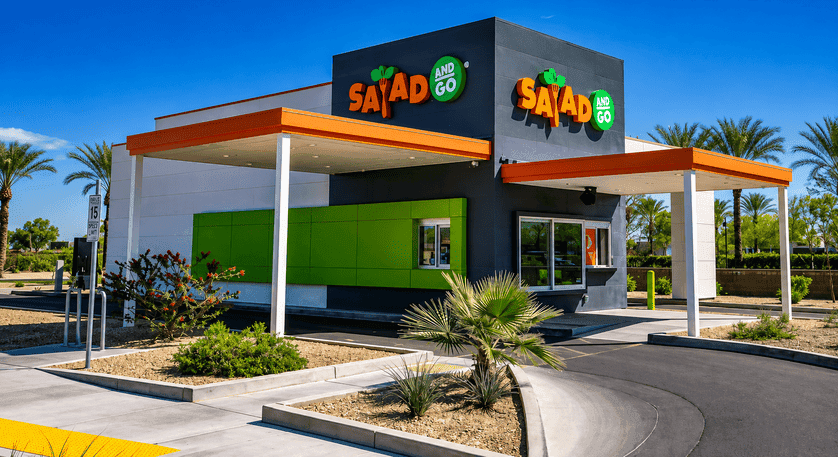
7 Brew has acquired 73 former Salad and Go locations, surpassing Dutch Bros with a $143M bid, signaling a major shift in the competitive landscape for drive-thru brands.
Sep 2, 2026
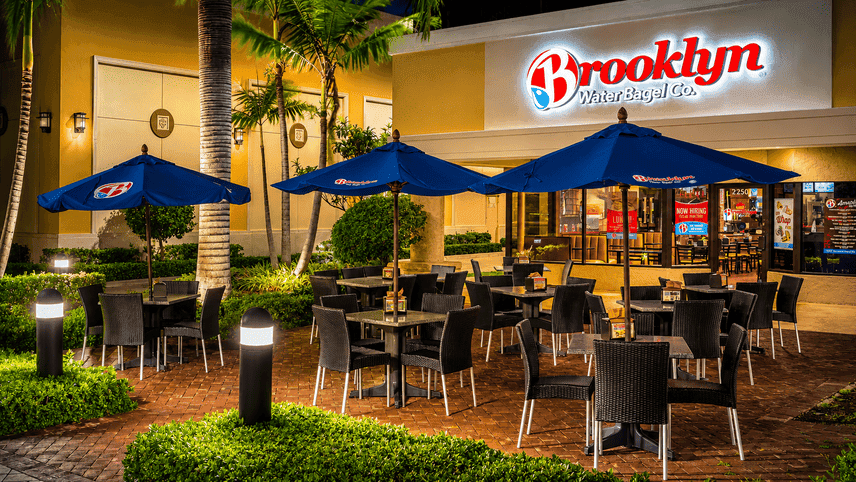
Brooklyn Water Bagel launches its first campus eatery at Nova Southeastern, signaling strategic growth and fresh potential for multi-unit operators seeking new market wins.
Sep 2, 2026

Restaurant labor management helps owners optimize staffing, control labor costs, improve productivity, monitor overtime, and maintain efficient restaurant operations.
Sep 2, 2026
Angry Chickz enters Illinois with its signature hot chicken concept and ambitious plans for Midwest expansion, setting the stage for new franchise opportunities and community engagement.
Sep 2, 2026
Chipotle makes its highly anticipated entry into Asia with a Seoul opening, partnering with Sangmidang Holdings and setting a template for future international growth.
Sep 2, 2026
Learn how to calculate restaurant cost of goods using inventory, purchases, COGS percentage, variance reviews, and regular tracking for profitability.
Aug 31, 2026

Unlock Exclusive Access To Webinars, Events, And The Latest News For Free!
Discover practical ways to control labor costs through accurate forecasting, efficient scheduling, employee productivity, overtime management, and performance tracking consistently.

Before optimizing labor costs, restaurant owners need a data-based view of where payroll dollars are going. Start by reviewing several weeks or months of payroll records and separating expenses into regular wages, salaries, overtime, payroll taxes, benefits, bonuses, paid time off, and other labor-related costs. Next, break labor spending down by department, position, shift, and daypart. This can reveal problems that a restaurant-wide total may hide. For example, front-of-house labor may stay within budget while kitchen labor consistently runs above plan. Scheduled hours should also be compared with actual hours worked. If a restaurant schedules 600 labor hours but employees work 640, that creates a 40-hour variance. At an average labor cost of $20 per hour, those extra hours add $800 to weekly labor spending. Track recurring cost drivers such as overtime, early clock-ins, late clock-outs, shift extensions, missed breaks, and unnecessary overlap. Even small variances can become significant when repeated across multiple employees and shifts. Use this data to establish a labor baseline. Monitoring average weekly labor cost, hours worked, overtime, and department-level spending gives owners a clear starting point for identifying inefficiencies and measuring future improvements. It helps managers separate normal fluctuations from recurring scheduling or productivity problems.
Once you understand your total labor expenses, the next step is to calculate your restaurant labor cost percentage. This metric shows how much of your restaurant's sales revenue is being spent on labor and gives you a clearer way to measure staffing efficiency over time. The basic formula is - Labor Cost Percentage = Total Labor Cost / Total Sales x 100 For example, if your restaurant generates $100,000 in monthly sales and spends $32,000 on labor, your labor cost percentage is 32%. This percentage is more useful than looking at payroll dollars alone because labor spending should be evaluated in relation to revenue. A restaurant may spend more on labor during a high-sales month, but the percentage can still improve if sales increase faster than payroll costs. Restaurant owners should calculate labor cost percentage on multiple levels, including - - Overall restaurant labor cost - Front-of-house labor - Back-of-house labor - Management labor - Labor cost by daypart - Labor cost by location for multi-unit operations Tracking these categories can reveal where labor is becoming inefficient. For example, lunch labor costs may remain high even when midday sales decline, or one location may consistently require more labor hours than similar units. Owners should also compare scheduled labor cost with actual labor cost. If the schedule was built around a 30% labor target but actual labor reaches 35%, investigate what caused the difference. Overtime, employees staying past scheduled hours, missed sales forecasts, or unexpected staffing changes may be responsible. Labor cost percentage should be tracked consistently rather than viewed as a one-time calculation. Reviewing it weekly, by pay period, and monthly can help restaurant owners identify trends before they become larger financial problems.

After calculating your current labor cost percentage, establish a realistic target that reflects how your restaurant actually operates. A useful labor cost target should account for your concept, service model, sales volume, operating hours, staffing structure, wage levels, and customer expectations. A quick-service restaurant, for example, may require a different staffing model than a full-service restaurant with hosts, servers, bartenders, bussers, and a larger kitchen team. This is why restaurant owners should avoid treating a single industry percentage as a universal goal. Start by reviewing your historical labor and sales data. Look at several weeks or months to identify your normal range, then compare stronger and weaker periods. This can help you determine whether your current labor cost is stable or regularly exceeds what your sales can support. You can also create different targets for different parts of the business. Instead of managing only one restaurant-wide number, set labor goals for - - Front-of-house operations - Back-of-house operations - Management payroll - Specific dayparts - Individual locations For example, a dinner shift may justify higher labor spending because it generates more revenue, while a slower afternoon period may require a leaner staffing plan. Labor targets should also be translated into actionable scheduling limits. If your forecasted sales for a day are $10,000 and your labor target is 30%, your planned labor spending would be approximately $3,000. Managers can use this figure as a guide when building the schedule. However, targets should not encourage managers to reduce staffing without considering operational needs. Cutting hours too aggressively can increase ticket times, reduce table turns, create employee burnout, and negatively affect the guest experience. Treat your labor cost target as a management range rather than a rigid ceiling. Review actual performance against the target regularly and adjust it when wage rates, menu prices, operating hours, sales patterns, or staffing requirements change. A realistic target gives managers a clear benchmark for controlling labor costs while still protecting restaurant performance.
Labor cost optimization starts before the schedule is published. Restaurant owners should forecast expected sales first, then determine how many labor hours the business can support. Scheduling employees without a sales forecast increases the risk of overstaffing during slow periods or understaffing when demand rises. A simple way to connect sales and labor is to calculate how much labor spending your forecast can support. For example, suppose your restaurant expects $12,000 in sales on Saturday and has a 30% labor cost target. Your planned labor budget would be - $12,000 x 30% = $3,600 in labor Managers can then build the schedule around that $3,600 budget while considering position coverage and service requirements. Sales forecasts should also be broken down by daypart. Consider a restaurant expecting - 1. Breakfast. $2,000 2. Lunch. $3,500 3. Afternoon. $1,000 4. Dinner. $5,500 Allocating the same number of employees throughout the day would not reflect customer demand. More labor may be required during lunch and dinner, while slower periods may operate effectively with fewer employees. Use several data points when forecasting demand, including historical sales, transaction counts, reservations, average check size, day-of-week performance, seasonality, local events, promotions, and weather-related patterns. Restaurant owners should also measure forecast accuracy. If sales were forecast at $50,000 for the week but actual sales reached only $45,000, the forecast was $5,000 too high. If staffing was scheduled around the original estimate, labor costs may exceed the planned percentage. Compare these three numbers every week - (1) Forecasted Sales (2) Scheduled Labor (3) Actual Sales For example - 1. Forecast. $60,000 in sales 2. Scheduled labor. $18,000 3. Target labor cost. 30% If actual sales fall to $52,000 while labor remains $18,000, actual labor cost rises to approximately 34.6%. This comparison helps managers see how sales fluctuations affect labor efficiency. Regularly improving sales forecasts allows restaurant owners to schedule the right number of employees at the right times, reduce unnecessary labor hours, and protect service levels during peak periods.
Once sales forecasts are in place, restaurant owners can use them to build schedules that better match labor with expected demand. The goal is to reduce unnecessary labor hours without leaving shifts understaffed. Start by comparing scheduled labor hours with forecasted sales by day and daypart. For example, suppose a restaurant forecasts $8,000 in sales for Monday and schedules 160 labor hours. If the average labor cost is $20 per hour, scheduled labor spending would equal - 160 hours x $20 = $3,200 That represents a 40% scheduled labor cost before the shift even begins. If the restaurant's target is 30%, managers should review whether all scheduled hours are necessary. Scheduling efficiency can also be measured using sales per labor hour, calculated as - Sales per Labor Hour = Sales / Labor Hours If a restaurant generates $12,000 in sales using 200 labor hours, sales per labor hour equals $60. If another comparable day generates the same sales with 180 hours, productivity increases to about $66.67 per labor hour. Managers should also track differences between scheduled and actual hours. Consider this weekly example - 1. Scheduled hours. 1,000 2. Actual hours worked. 1,080 3. Average hourly labor cost. $22 The extra 80 hours create approximately $1,760 in additional labor spending before considering any overtime premiums. Look for recurring causes of schedule variance, including early clock-ins, employees staying after scheduled shifts, excessive shift overlap, unnecessary opening or closing coverage, and overtime. Restaurant owners can also use staggered start times instead of scheduling entire teams at the same time. For example, rather than bringing six employees in at 4.00 p.m., managers may schedule two at 4.00, two at 4.30, and two at 5.00 as dinner demand builds. Track several scheduling metrics each week - (1) Scheduled labor hours (2) Actual labor hours (3) Labor cost percentage (4) Sales per labor hour (5) Overtime hours Reviewing these numbers together makes it easier to identify where schedules are costing more than planned. Efficient scheduling does not mean consistently scheduling the fewest employees possible. It means matching staffing levels as closely as possible to customer demand so the restaurant can control labor cost while maintaining service speed, productivity, and guest experience.

Reducing labor cost does not always require reducing headcount or cutting scheduled hours. Restaurant owners can often improve labor efficiency by helping existing employees work more productively and by cross-training them to perform multiple roles. Cross-training gives managers more flexibility when customer demand changes throughout the day. For example, a cashier who is also trained to assist with order assembly can support the kitchen during a rush. A server trained on basic host responsibilities can help manage the front door when arrivals increase. In smaller operations, employees who can handle several tasks may reduce the need to schedule an additional person for every individual function. Productivity should also be measured, not assumed. Useful metrics can include - 1. Sales per labor hour - Shows how much revenue the restaurant generates for every hour of labor used. 2. Transactions per labor hour - Measures how many customer transactions employees handle during a given amount of labor time. 3. Labor hours by daypart - Helps identify periods where staffing may be high compared with customer demand. 4. Actual hours versus scheduled hours - Reveals whether employees routinely work longer than planned. For example, if a restaurant generates $10,000 in sales using 200 labor hours, it produces $50 in sales per labor hour. If operational improvements allow the restaurant to generate the same $10,000 using 185 hours, sales per labor hour increases to approximately $54.05. Restaurant owners should also examine workflows that waste employee time. Poorly organized prep stations, unnecessary movement between work areas, unclear responsibilities, slow shift handoffs, or repeated manual tasks can reduce productivity even when staffing levels appear appropriate. Training can help address these problems. Employees should understand standard procedures, role expectations, opening and closing responsibilities, and how to move between tasks during changing demand. However, productivity goals should remain realistic. Continually asking fewer employees to perform more work can increase mistakes, burnout, and turnover. The objective is to make every scheduled labor hour more productive. By combining cross-training, clear workflows, performance tracking, and efficient task assignments, restaurant owners can improve labor utilization while maintaining service quality and controlling overall labor cost.
Even a well-planned schedule can exceed budget if restaurant owners do not monitor what happens after employees clock in. Small labor cost leaks can accumulate across multiple shifts and gradually push payroll above target. Start by comparing scheduled labor with actual labor. If employees regularly clock in early, stay late, skip required approvals for overtime, or work beyond scheduled shift times, actual payroll may be significantly higher than planned. For example, assume 20 employees each work an extra 15 minutes per shift, five days per week. That creates - 20 employees x 0.25 hours x 5 days = 25 additional labor hours per week At an average labor cost of $22 per hour, those extra minutes equal approximately $550 per week, or more than $28,000 over 52 weeks, before considering overtime premiums or other payroll-related costs. Restaurant owners should regularly monitor several sources of labor variance, including - 1. Overtime hours - Identify which employees and departments generate overtime most frequently. 2. Early clock-ins - Determine whether employees are starting before managers actually need them. 3. Late clock-outs - Review why employees consistently remain after scheduled end times. 4. Schedule extensions - Track shifts that managers repeatedly extend because of demand, prep requirements, or closing tasks. 5. Absenteeism and call-outs - Unexpected absences may force managers to use overtime or higher-cost replacement coverage. 6. Break and timekeeping issues - Inaccurate records or inconsistent procedures can create payroll errors and compliance risks. Managers should also compare labor performance with sales results. For instance, if a location spends $15,000 on labor against $50,000 in weekly sales, labor cost equals 30%. If labor rises to $17,000 while sales remain unchanged, the percentage increases to 34%. The $2,000 difference should be investigated rather than treated as a normal fluctuation. A useful weekly review can follow this sequence - (1) Scheduled Labor (2) Actual Labor (3) Overtime (4) Sales (5) Labor Cost Percentage Variance The purpose is not to eliminate every difference between scheduled and actual payroll. Restaurants operate in changing conditions, and unexpected demand will sometimes require additional staffing. Instead, focus on identifying recurring labor cost leaks. When the same variances appear week after week, restaurant owners can adjust scheduling rules, manager approvals, staffing levels, or workflows to bring labor spending back under control.