A Complete Guide to Restaurant Tip Pooling Rules
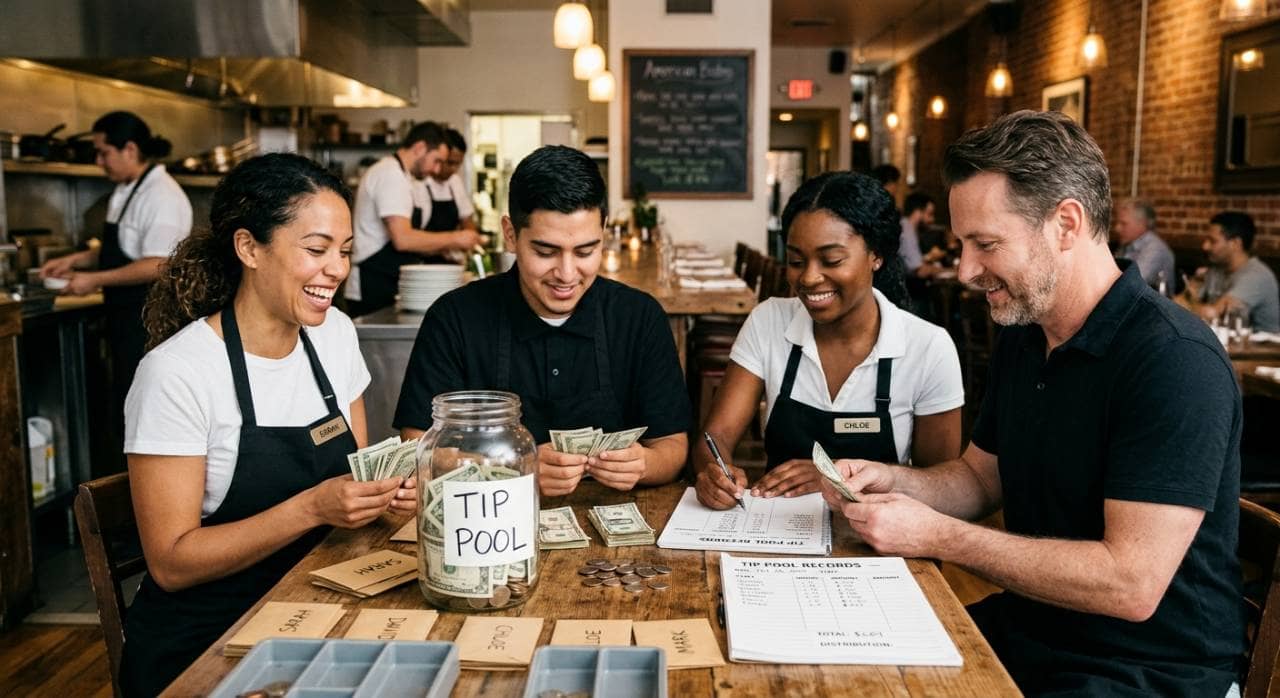
Understand tip pooling rules, employee eligibility, distribution methods, compliance requirements, recordkeeping practices, and policies restaurant owners need for proper tip management.
Oct 2, 2026
Understand tip pooling rules, employee eligibility, distribution methods, compliance requirements, recordkeeping practices, and policies restaurant owners need for proper tip management.
Oct 2, 2026
Whit's Frozen Custard hires industry veteran Amos Durbin as COO to guide franchise expansion, drawing on two decades of restaurant leadership experience.
Oct 2, 2026
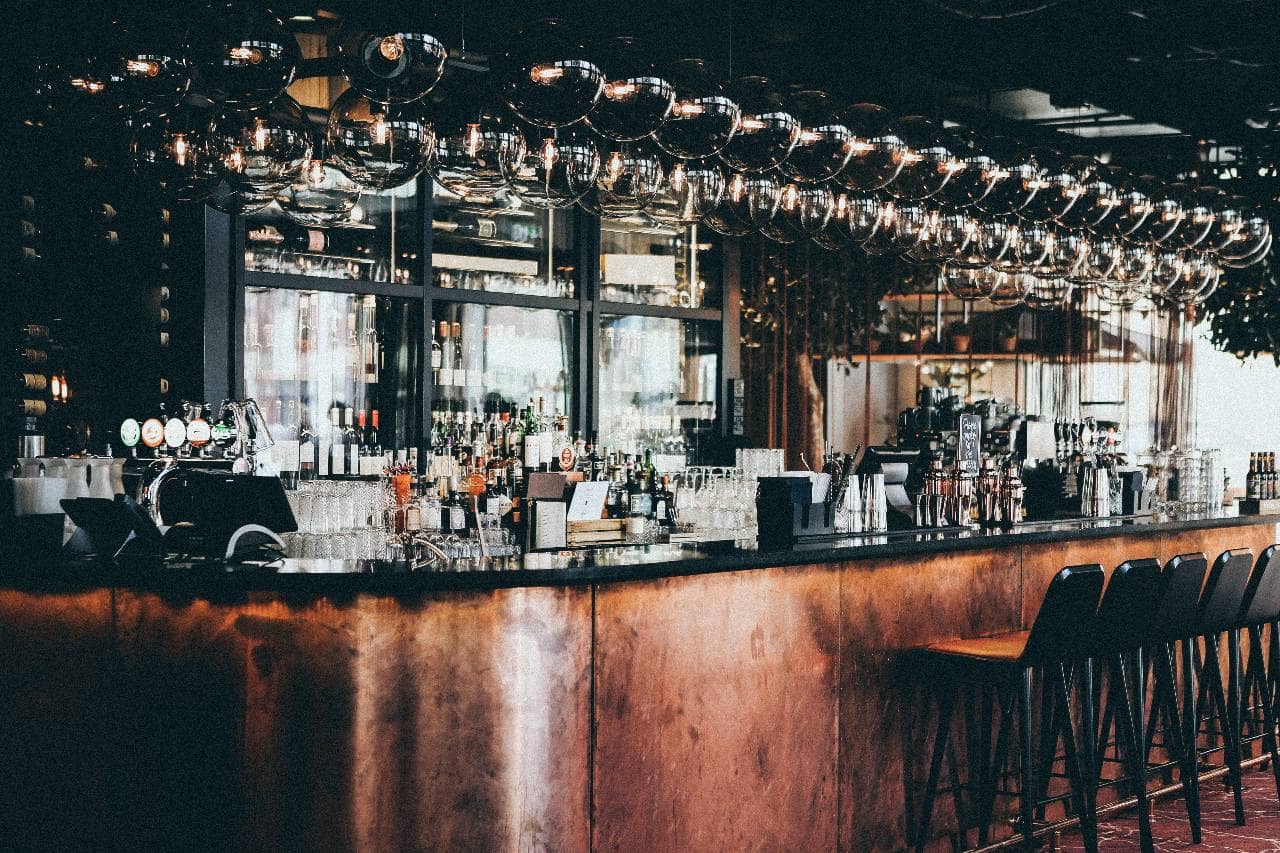
Learn how to open a bar covering concept, funding, licensing, location, equipment, staffing, menu, and marketing, from planning to opening night.
Sep 30, 2026
Evaluate restaurant industry performance in Q3 2026 through key trends affecting restaurant sales, traffic, consumer spending, labor, costs, and technology.
Oct 2, 2026
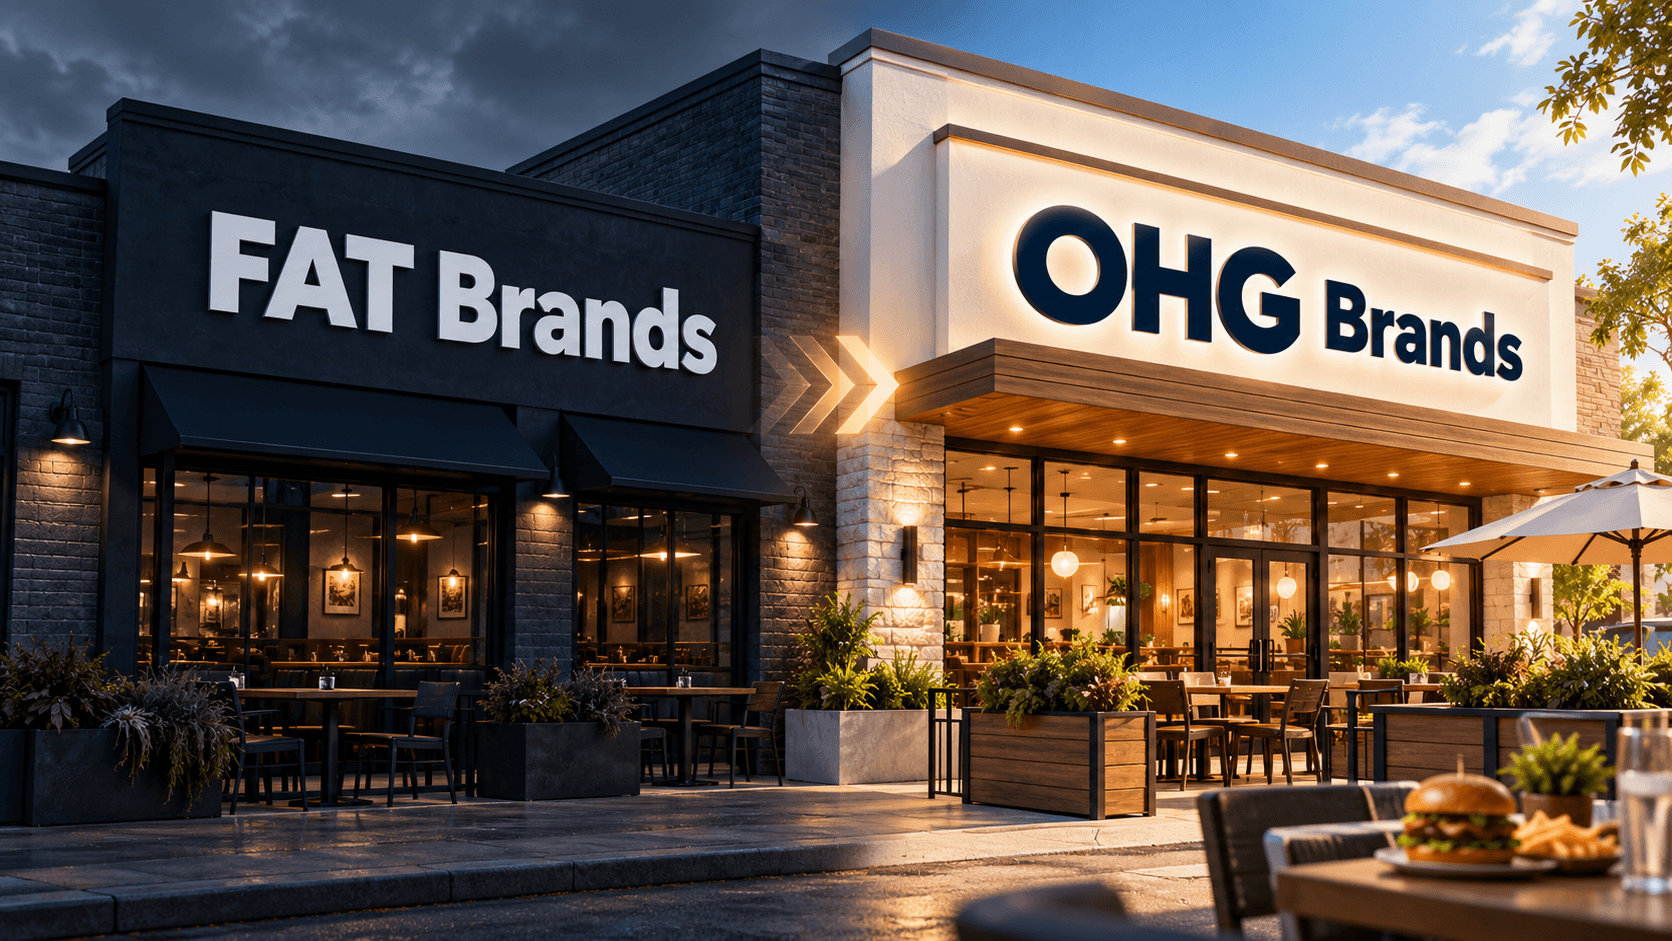
FAT Brands' $1B acquisition empire fell into bankruptcy and sold for $965M, re-emerging as OHG Brands with 1,700 restaurants.
Oct 1, 2026
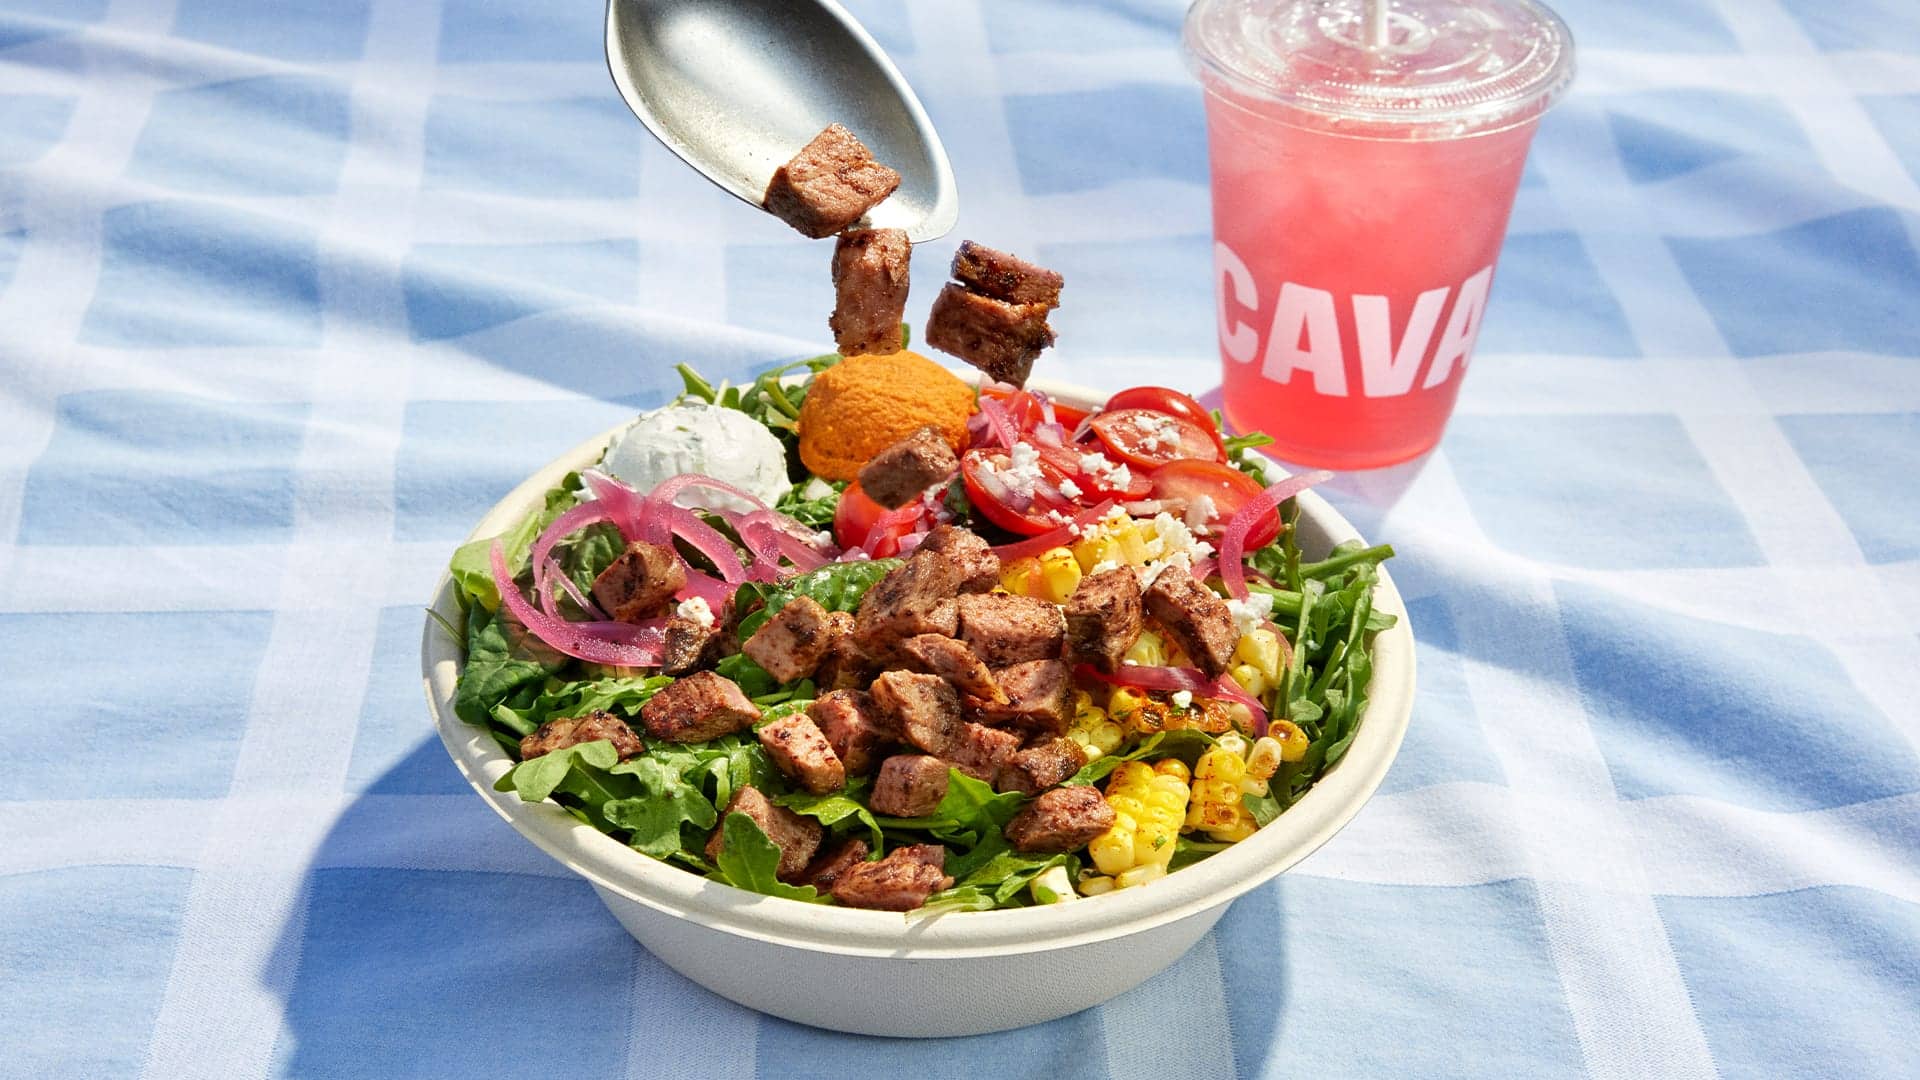
CAVA names John Ludeke, former Dr. Squatch Chief Brand Officer, as its new CMO to drive national growth and guest loyalty.
Oct 1, 2026
La Madeleine's CEO John Dillon steps down mid-turnaround, leaving a menu overhaul, new coffee program, and franchise growth plans in limbo.
Oct 1, 2026
Hot Head Burritos promotes longtime operator Peter Wiley to corporate VP, chief marketing and chief technology officer, blending brand strategy with tech oversight.
Oct 1, 2026
Mo' Bettahs names Don Crocker, a Chick-fil-A and Inspire Brands veteran, as chief development officer to lead its national corporate-owned expansion.
Sep 30, 2026
Wage hikes, the penny's end, new NLRB rules, California sugar labels, and franchise law changes are converging on operators this year.
Sep 30, 2026
Unlock Exclusive Access To Webinars, Events, And The Latest News For Free!
Evaluate restaurant industry performance in Q3 2026 through key trends affecting restaurant sales, traffic, consumer spending, labor, costs, and technology.

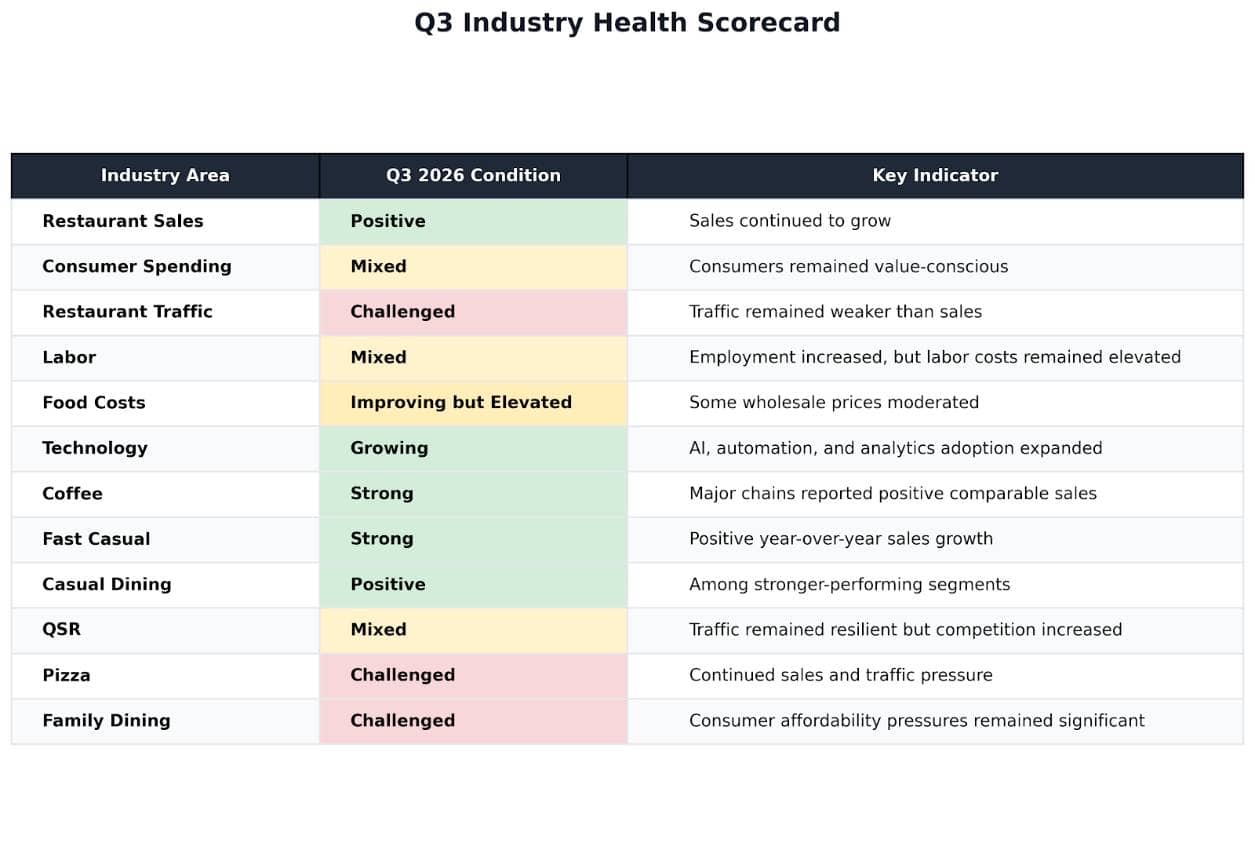
The restaurant industry entered the third quarter of 2026 with a mixed performance picture. Restaurant sales continued to grow, but uneven customer traffic, persistent cost pressures, and increasingly value-conscious consumers continued to challenge restaurant profitability. The data projected $1.55 trillion in total U.S. restaurant and foodservice sales for 2026, with inflation-adjusted growth expected to remain modest. Q3 data showed that restaurants continued to attract customers despite household budget pressures. In August, U.S. eating and drinking places generated $105.1 billion in seasonally adjusted sales, up 1.2% from July and marking the fifth consecutive month of sales growth. However, sales growth does not necessarily indicate stronger traffic or margins because menu price increases continue to contribute to nominal sales growth. Key Forces Shaping Restaurant Performance Several trends defined the Q3 2026 restaurant environment - 1. Sales remained positive - Restaurant sales continued to increase through the quarter, although underlying demand varied across consumers and restaurant segments. 2. Consumers became more selective - Q3 research found that 39% of consumers spent less at restaurants than during Q2, while 40% reported relying more heavily on discounts and value promotions. 3. Restaurant visits remained important - 53% of consumers reported dining at a restaurant during the previous week, while 50% ordered takeout or delivery. 4. Operating costs stayed elevated - Food and labor costs remained among the largest expenses facing restaurant operators, putting continued pressure on margins. 5. Technology remained an operational priority - Restaurant operators continued looking toward digital ordering, automation, analytics, and other technologies to improve productivity and control costs. The Q3 environment also highlighted a growing difference between consumer demand and consumer spending capacity. Restaurants continued to be an important part of consumers' lifestyles, but affordability concerns influenced where, when, and how much customers spent. Higher-income households remained more active restaurant consumers, while lower- and middle-income households faced greater financial pressure. For restaurant owners, this makesrevenue alone an incomplete measure of performance. A restaurant can generate higher sales while experiencing weaker traffic, higher labor expenses, increased food costs, or lower margins. Tracking sales alongside customer traffic, average check, labor cost, food cost, and other operating metrics provides a clearer view of business performance.
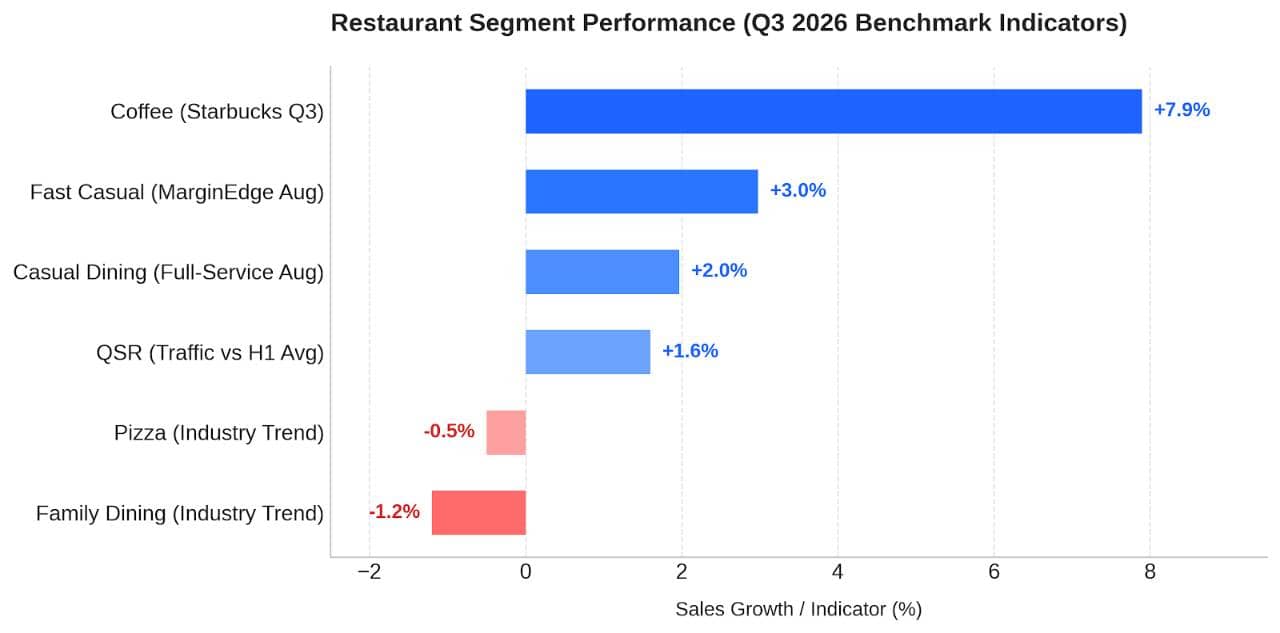
Restaurant sales performance in Q3 2026 varied significantly by restaurant type. Some restaurant segments continued to generate positive sales growth, while others faced weaker traffic and greater pressure from consumer price sensitivity. Looking at performance by restaurant type provides a clearer picture of where demand was strongest during the quarter. At the broader industry level, U.S. eating and drinking places generated $105.1 billion in seasonally adjusted sales in August, up 1.2% from July. August marked the fifth consecutive month of restaurant sales growth. However, the performance of individual restaurant segments was not uniform. Restaurant Type Sales and Growth Comparison Q3 2026 performance differed across coffee, fast casual, casual dining, QSR, pizza, and family dining. The available industry data points to stronger performance in some higher-value and experience-oriented segments, while value-sensitive segments faced greater pressure. 1. Coffee - Coffee remained one of the stronger restaurant categories entering Q3. Starbucks reported U.S. comparable-store sales growth of 7.9% in its fiscal Q3, driven by a 4.2% increase in comparable transactions and a 3.6% increase in average ticket. Earlier 2026 performance also showed strong momentum across major coffee chains, with Starbucks, Dutch Bros, and Black Rock Coffee Bar all reporting positive comparable-sales growth in Q2. 2. Fast Casual - Fast casual was one of the stronger-performing segments in the available Q3 sales data. MarginEdge reported 2.98% year-over-year sales growth in August, compared with 1.97% for full-service restaurants. Fast-casual traffic also remained relatively resilient, running only 0.4% below its first-half 2026 average during the final week of August. 3. Casual Dining - Casual dining continued to perform relatively well during Q3. Black Box Intelligence identified Casual Dining among the segments outperforming in its Q3 assessment. The segment benefited from consumers continuing to seek restaurant experiences that offer perceived value, particularly when the price difference between a casual-dining meal and a fast-food meal narrowed. 4. QSR - Quick-service restaurants continued to benefit from convenience and value, but performance was more mixed than the category's traditional value positioning might suggest. QSR traffic remained 1.6% above its first-half 2026 average during the week of August 2430, although traffic moderated from earlier levels. At the same time, industry analysis indicated that the traditional QSR price advantage over fast casual and casual dining had narrowed, increasing competitive pressure. 5. Pizza - Pizza faced greater pressure during Q3. Black Box Intelligence identified Pizza among the segments experiencing continued headwinds. Earlier 2026 industry analysis also pointed to missed sales expectations among pizza chains and increased competition as consumers evaluated restaurant purchases based on overall value. 6. Family Dining - Family Dining remained one of the more challenged segments. Black Box Intelligence reported that Family Dining continued to experience pressure, with declining same-store sales earlier in 2026 as traffic weakened. Higher average checks also created an affordability challenge for a segment that traditionally serves middle- and lower-middle-income consumers. Which Restaurant Types Performed Better in Q3 2026? The available Q3 evidence points to stronger performance from Fast Casual, Casual Dining, and Coffee, although the measures are not directly interchangeable. Fast Casual recorded 2.98% year-over-year sales growth in August in MarginEdge's dataset, while Coffee showed strong comparable-sales growth among major chains. Black Box's Q3 assessment also identified Casual Dining among the segments outperforming. Family Dining and Pizza faced greater pressure, while QSR performance was more mixed. QSRs continued to attract traffic because of convenience and value, but the narrowing price gap with other restaurant formats created additional competitive pressure. The comparison also shows why restaurant owners should avoid judging performance solely by sales growth. A segment can generate higher sales because of menu price increases or larger checks without gaining customers. Conversely, a segment with moderate sales growth may have stronger underlying demand if transaction volume is also increasing. What Restaurant Owners Can Learn From the Q3 Comparison The Q3 2026 performance differences highlight several trends restaurant owners should monitor - 1. Value and affordability - Consumers continued to evaluate restaurant purchases based on perceived value. 2. Traffic versus ticket growth - Higher average checks helped support sales in several segments even when traffic was weaker. 3. Convenience - QSR and fast-casual formats continued to benefit from convenient dining options. 4. Experience - Casual and upscale-casual concepts benefited from consumers looking for greater perceived value from restaurant occasions. 5. Beverage demand - Coffee remained a strong category, particularly among younger consumers and customers willing to pay for customization and convenience. 6. Affordability pressure - Family dining and pizza faced greater challenges as consumers became more selective about restaurant spending. Restaurant owners should therefore compare sales growth, transaction growth, average check, and customer traffic rather than relying on revenue alone. The strongest sales performance is more meaningful when it is supported by healthy customer demand rather than primarily by higher prices.

Consumer spending remained an important factor shaping restaurant performance in Q3 2026. Customers continued to prioritize dining out, but many became more selective about where and how they spent their restaurant budgets. This created a market where restaurants could still attract demand while facing greater pressure to demonstrate value. Affordability became a central consideration for restaurant customers. Some consumers reduced their restaurant spending, while others continued dining out but looked more closely at prices, promotions, portion sizes, and overall value. This shift affected both the frequency of visits and the types of restaurants and menu items consumers chose. Key Consumer Spending Trends Several changes in customer behavior stood out during Q3 - 1. Consumers remained engaged with restaurants - Dining out continued to be part of regular consumer routines, despite broader household budget pressures. 2. Value influenced purchasing decisions - Customers increasingly considered discounts, promotions, combo meals, and affordable menu options when deciding where to spend. 3. Spending varied by income - Higher-income consumers generally had more flexibility to maintain restaurant spending, while lower- and middle-income households faced greater affordability pressures. 4. Dining occasions became more deliberate - Consumers could reduce the frequency of restaurant visits or adjust what they purchased when budgets became tighter. 5. Off-premise dining remained significant - Takeout and delivery continued to provide important purchasing options for consumers seeking convenience. Restaurant owners should pay attention to the difference between customer demand and customer spending. A restaurant may continue receiving regular traffic while customers purchase less expensive items, use more promotions, or reduce add-on purchases. These changes can affect average check size even when transaction counts remain relatively stable. What Consumer Behavior Means for Restaurant Owners Understanding customer spending patterns can help restaurant owners make more informed decisions about menus, pricing, promotions, and service channels. Rather than focusing only on whether sales increased or decreased, owners can examine what customers are buying, how frequently they visit, and which channels they use. For example, tracking average check size alongside transaction counts can reveal whether revenue changes are being driven by more customers or higher spending per customer. Monitoring sales by menu category can also show whether customers are moving toward lower-priced options or continuing to purchase premium items. Promotions should also be evaluated based on their effect on overall revenue and profitability. A discount may increase transaction volume but reduce the amount earned from each transaction. Measuring promotional sales against regular sales, average check size, and gross margin can help determine whether an offer is producing meaningful business results. Q3 2026 showed that consumers continued to value restaurant experiences while becoming increasingly attentive to affordability. Restaurant owners that closely monitor spending patterns, visit frequency, average checks, and ordering channels can better understand how changing consumer behavior is affecting restaurant performance.
Restaurant traffic remained one of the more challenging areas of restaurant performance during Q3 2026. While restaurant sales continued to increase, customer visits did not consistently move in the same direction. This distinction is important because higher sales can result from menu price increases or larger checks even when fewer customers are visiting restaurants. In July, 40% of restaurant operators reported higher customer traffic compared with July 2025, while 49% reported lower traffic. July marked the 17th month in the previous 18 months in which operators reported a net decline in customer traffic. More recent traffic data also pointed to a moderation in restaurant visits toward the end of August. During the week of August 2430, visits to full-service restaurants were 5.5% below their first-half 2026 average, while quick-service restaurants remained 1.6% above their first-half average. Key Restaurant Traffic Trends Several factors shaped customer demand during Q3 - 1. Traffic remained weaker than sales - Restaurant revenue continued to grow even as customer visits remained under pressure. 2. Restaurant segments performed differently - Quick-service, fast-casual, and full-service restaurants experienced different traffic patterns. 3. Value influenced customer decisions - Consumers facing tighter budgets increasingly considered price and perceived value when deciding where to dine. 4. Digital and off-premise channels remained important - Takeout and delivery continued to provide alternatives to traditional dine-in visits. 5. Traffic varied throughout the quarter - Weekly and monthly changes demonstrate why restaurant owners should monitor traffic regularly rather than relying only on quarterly results. Restaurant owners should track customer traffic separately from sales to understand the underlying health of demand. A restaurant that reports higher revenue but fewer transactions may be benefiting from increased prices or higher average checks rather than attracting more customers. Metrics Restaurant Owners Should Monitor Several traffic metrics can help provide a clearer view of customer demand - 1. Total transactions - Measures the number of customer purchases during a specific period. 2. Customer visits - Tracks changes in restaurant traffic over time. 3. Same-store traffic - Compares customer visits at the same locations across different periods. 4. Average check - Shows how much customers spend per transaction. 5. Traffic by daypart - Identifies changes in breakfast, lunch, dinner, and late-night demand. 6. Traffic by channel - Compares dine-in, takeout, delivery, and other ordering channels. 7. Year-over-year traffic - Helps account for seasonal patterns when comparing performance. Restaurant owners can also compare traffic with sales to identify important changes in customer behavior. If sales increase while transactions decline, the business should examine pricing and average check trends. If both sales and transactions increase, stronger customer demand may be contributing more directly to revenue growth. Monitoring traffic by day and daypart can also reveal where demand is weakening. A restaurant may maintain strong dinner traffic while experiencing declining lunch visits, for example. Identifying these differences can help owners evaluate staffing, promotions, operating hours, and menu strategies based on actual customer demand.
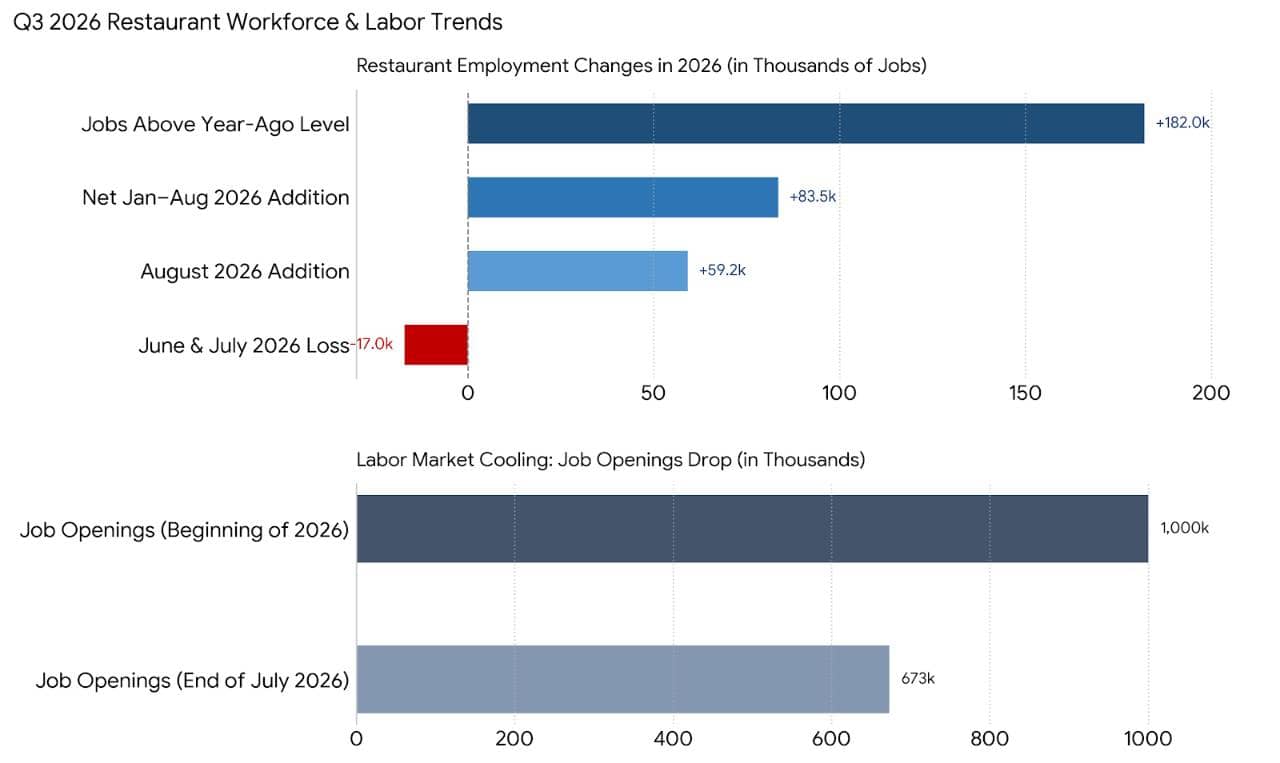
Labor remained one of the most important factors affecting restaurant performance in Q3 2026. Restaurant operators continued to balance staffing needs with uneven customer traffic, wage pressures, and changing labor-market conditions. While restaurant employment increased during the quarter, hiring conditions remained mixed, making workforce planning an important part of restaurant operations. Eating and drinking places added 59,200 jobs in August, the largest single-month employment increase since January 2023. This followed employment declines in both June and July, when the industry lost more than 17,000 jobs combined. During the first eight months of 2026, restaurants added 83,500 jobs, bringing employment to nearly 182,000 jobs above year-ago levels. At the same time, the labor market showed signs of cooling. Restaurant and accommodation job openings declined to 673,000 at the end of July, down substantially from nearly 1 million at the beginning of the year. Hiring and employee separations also decreased, suggesting less workforce churn compared with earlier in the year. Key Labor Trends Shaping Restaurants Several workforce developments stood out during Q3 - 1. Restaurant employment increased - August's employment gains demonstrated continued demand for restaurant workers. 2. Hiring conditions became more moderate - Job openings, hires, and separations declined during the summer. 3. Labor availability remained a concern - A lower labor-force participation rate continued to limit the pool of available workers. 4. Wage costs remained elevated - Restaurant employee wages remained significantly above pre-pandemic levels, continuing to affect operating expenses. 5. Staffing needs varied by restaurant segment - Full-service and limited-service restaurants continued to experience different employment recovery patterns. Labor costs also remained a significant pressure on restaurant profitability. Restaurant expenses have increased substantially since 2019, with food and labor representing two of the largest expense categories. Average hourly earnings for restaurant employees were 41% higher than pre-pandemic levels as of 2026. Workforce Metrics Restaurant Owners Should Track Restaurant owners can use several workforce metrics to evaluate labor performance - 1. Labor cost percentage - Measures labor expenses relative to restaurant sales. 2. Sales per labor hour - Shows how much revenue is generated for each hour worked. 3. Overtime hours - Identifies additional labor expenses caused by extended employee schedules. 4. Employee turnover - Measures how frequently employees leave and need to be replaced. 5. Scheduled versus actual hours - Identifies differences between planned staffing and hours actually worked. 6. Labor cost by daypart - Shows when staffing expenses are highest relative to sales. 7. Productivity by location - Helps multi-unit operators compare workforce efficiency across restaurants. Q3 2026 demonstrated that restaurant labor management requires balancing employee availability, staffing levels, wages, and customer demand. Monitoring labor costs alongside sales and traffic allows restaurant owners to determine whether staffing levels are aligned with actual business conditions rather than relying solely on headcount or total payroll.

Food costs remained a major consideration for restaurant operators in Q3 2026. While wholesale food prices showed some signs of moderation during the quarter, prices remained well above pre-pandemic levels and individual commodities continued to move in different directions. This created a more complicated cost environment for restaurants, particularly businesses with menus heavily dependent on ingredients experiencing above-average price increases. Average wholesale food prices declined 0.1% from July to August, following a 1.3% decline in July. By August, wholesale food prices were 1.9% below their level a year earlier. However, the overall index remained more than 33% above its February 2020 level, demonstrating that recent declines have not returned food costs to historical levels. Key Food Cost Trends in Q3 2026 Several food-cost developments shaped restaurant operations during the quarter - 1. Wholesale food prices moderated - Overall wholesale food prices declined during July and August. 2. Commodity performance varied - Fats and oils, seafood, fresh fruit, wheat flour, and beef remained above year-ago prices, while eggs, butter, pork, poultry, vegetables, and several other categories declined. 3. Menu prices continued to rise - Restaurant menu prices increased 0.3% in both July and August, with prices 3.4% higher than August 2025. 4. Food costs remained elevated - Despite recent wholesale price declines, food prices remained substantially higher than before the pandemic. 5. Margins remained under pressure - Higher food and other operating expenses continued to require careful cost management. The difference between overall food prices and individual ingredient costs is particularly important for restaurant owners. A restaurant's actual food-cost pressure depends heavily on its menu mix. A restaurant that relies heavily on beef, seafood, oils, or other commodities experiencing price increases may face greater pressure than one whose primary ingredients have become less expensive. Restaurant Metrics to Monitor Restaurant owners can use several metrics to understand how food costs are affecting profitability - 1. Food cost percentage - Measures food expenses as a percentage of sales. 2. Cost per menu item - Shows how ingredient costs affect individual dishes. 3. Theoretical food cost - Estimates food costs based on recipes and expected usage. 4. Actual food cost - Measures the food actually consumed or used during a period. 5. Food waste - Tracks ingredients and prepared food that are discarded. 6. Inventory variance - Identifies differences between expected and actual inventory levels. 7. Gross profit per menu item - Shows how much revenue remains after accounting for the cost of ingredients. Monitoring these metrics can help identify whether margin changes are coming from ingredient prices, waste, portion sizes, purchasing practices, or menu pricing. Comparing theoretical and actual food costs can also help restaurant owners identify operational differences that may otherwise remain hidden. Menu pricing is another important consideration. Restaurant menu prices were 3.4% higher year over year in August, while food-away-from-home prices were also up 3.4% over the same period. The USDA's September 2026 outlook projected food-away-from-home prices to increase 3.5% for the full year.
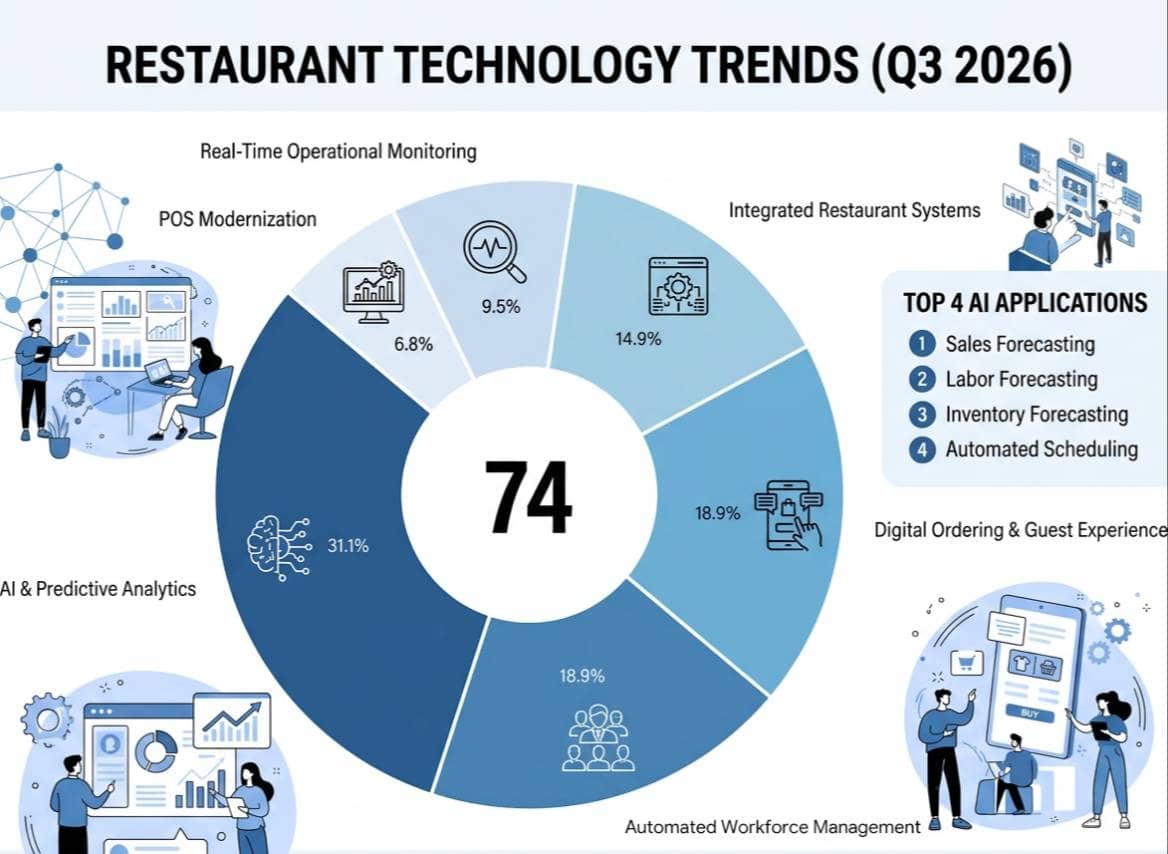
Technology continued to play a larger role in restaurant operations during Q3 2026. Restaurant owners increasingly used technology to improve efficiency, manage costs, understand customer behavior, and make faster operational decisions. The focus has also shifted from simply adopting new tools to connecting technology with measurable business needs. AI and automation received particular attention during 2026. Restaurant operators were using AI-related capabilities for areas such as sales forecasting, labor forecasting, inventory forecasting, automated scheduling, and operational optimization. At the same time, digital ordering, POS modernization, analytics, and connected back-office systems remained important technology priorities. Key Restaurant Technology Trends Several technology developments shaped restaurant operations in Q3 - 1. AI and predictive analytics - Restaurants increasingly used AI to analyze sales, labor, inventory, and customer data and support forecasting and decision-making. 2. Automated workforce management - Scheduling, labor forecasting, time tracking, and workforce communication continued to move toward more automated systems. 3. Digital ordering - Mobile ordering, restaurant websites, QR ordering, kiosks, and other digital channels remained important parts of the customer experience. 4. POS modernization - Restaurants continued investing in POS systems and connected technologies that can provide more timely operational data. 5. Integrated restaurant systems - Connecting POS, inventory, labor, accounting, ordering, and reporting systems became increasingly important as restaurants sought to reduce fragmented data. 6. Real-time operational monitoring - Alerts, analytics, and automated reporting helped operators identify issues and respond more quickly. Technology adoption was not limited to customer-facing experiences. Back-office operations became an increasingly important area for technology investment. Restaurants can use connected systems to bring sales, labor, inventory, and operational data into a more unified view, reducing the need to manually collect information from separate platforms. AI Moves Into Restaurant Operations AI was also moving beyond experimental applications and into specific restaurant workflows. Research from Fourth found that among operators already using AI or automation, sales forecasting was the most common application, followed by labor forecasting, inventory forecasting, and automated scheduling. This creates several potential applications for restaurant owners - - Forecasting sales based on historical and current demand. - Adjusting staffing levels based on expected sales. - Predicting inventory requirements. - Identifying potential food waste. - Automating repetitive administrative tasks. - Analyzing restaurant performance data. - Identifying operational issues that require attention.The technology trend is therefore less about adopting AI simply because it is available and more about using data and automation to solve specific operational problems. Digital customer experiences also remained a major investment area. A 2026 restaurant technology benchmark found that digital guest experience was the leading technology investment area among surveyed QSR and fast-casual brands, while POS modernization and operational optimization were also significant priorities. For restaurant owners, technology decisions should be connected to measurable outcomes. A new system should ideally help answer questions such as - Does it reduce administrative work? Does it improve labor productivity? Does it reduce food waste? Does it provide faster access to operational data? Does it improve ordering or payment efficiency?

Q3 2026 showed that restaurant performance cannot be measured through sales alone. Restaurant owners need to look at sales, traffic, consumer spending, labor, food costs, and technology together to understand what is driving performance. The quarter reflected continued demand for restaurant experiences while consumers became more selective and operators continued managing elevated costs. Key Trends From Q3 2026 The most important trends restaurant owners should carry forward include - 1. Restaurant sales remained resilient - U.S. restaurant sales continued to grow during the quarter, supported by ongoing consumer demand. 2. Consumer spending became more selective - 39% of consumers reported spending less at restaurants in Q3 than in Q2, demonstrating continued affordability pressure. 3. Traffic remained uneven - Restaurant visits varied considerably by segment, with QSR traffic remaining above its first-half average while full-service traffic was lower during late August. 4. Labor remained a major operating consideration - Restaurants continued balancing staffing requirements with labor costs and changing workforce conditions. 5. Food costs continued to pressure margins - Restaurant operators remained exposed to elevated food and operating expenses even as some commodity prices moderated. 6. Technology became increasingly operational - AI, automation, analytics, and connected restaurant systems continued to provide tools for managing labor, inventory, sales, and customer demand. Measure More Than Revenue Restaurant owners can use Q3 performance to establish a broader set of operating benchmarks. Revenue, transactions, average check, labor cost, food cost, and productivity should be reviewed together rather than independently. For example, rising sales combined with declining traffic can indicate that higher prices or larger checks are contributing to revenue growth. Rising sales and traffic alongside increasing labor and food costs may produce a very different financial result than the headline sales number suggests. A useful Q3 performance review can include - 1. Sales - Total sales, same-store sales, and sales by channel. 2. Customer demand - Transactions, traffic, and visit frequency. 3. Consumer spending - Average check, menu mix, and promotional usage. 4. Labor - Labor cost, overtime, and sales per labor hour. 5. Food costs - Food cost percentage, waste, and inventory variance. 6. Operations - Productivity, daypart performance, and operating costs. 7. Technology - Automation, digital ordering, analytics, and system adoption. Use Q3 Data to Plan the Next Quarter The Q3 environment also demonstrates why restaurant owners should use current operating data rather than industry trends alone when making decisions. Industry reports provide useful context, but individual restaurants can experience significantly different results based on concept, location, customer demographics, menu mix, and operating model. Owners can compare their Q3 results against the same period last year and against the previous quarter. Reviewing those changes across sales, traffic, labor, food costs, and average check can help identify where performance improved and where additional attention may be needed. The central restaurant industry trend in Q3 2026 was a continued need to balance demand with affordability and operating efficiency. Consumers continued to spend on restaurants, but many became more selective. At the same time, operators faced ongoing labor and cost pressures while investing in technology to improve efficiency. By tracking these trends alongside restaurant-specific performance metrics, owners can develop a more complete view of Q3 performance and identify the operational areas that require attention heading into the next quarter.