When Is the Right Time to Sell Your Restaurant Franchise Locations?
Learn when to sell franchise locations by evaluating financial performance, operations, market conditions, lease terms, and long-term business goals carefully.
Jul 20, 2026
Learn when to sell franchise locations by evaluating financial performance, operations, market conditions, lease terms, and long-term business goals carefully.
Jul 20, 2026
Wingstop adds 382 U.S. units to 3,056 total as comps dip; 2026 outlook hinges on loyalty, Smart Kitchen, and category tailwinds.
Jul 20, 2026
Topgolf Media Networks turns 100+ venues into an ad platform with 42M visits and 28,000 screens, tapping retail media tactics for measurable brand activations.
Jul 20, 2026
Domino’s leverages rising order volumes to boost revenue and market share despite industry challenges in Q2 2026, offering key lessons for restaurant owners.
Jul 20, 2026
Discover how Fresh off the Boat in Santa Ana has built a thriving, health-focused Mexican-Mediterranean fusion restaurant. Explore operational insights, business strategies, and the customer experience that set this unique concept apart.
Jul 20, 2026
Burger King launches its “Your Way Champion” managerial role, focusing on guest experience, order customization, and staff engagement. Restaurant operators can glean insights for elevating hospitality in their own venues.
Jul 20, 2026
If your restaurant is busy but profits feel thin, food cost is usually the first place to look. Not because it is always the problem, but because it is the most controllable variable in your P&L.
Jul 20, 2026
Thomas Keller Restaurant Group will pay $2M to settle an EEOC harassment and retaliation case tied to Bouchon Las Vegas, closing a long-running action from 2018.
Jul 19, 2026
Fresh Kitchen names Bill Knopf and Matt Livingston to lead operations and development as the clean-label bowl brand targets growth beyond 100 locations.
Jul 18, 2026
Hardee’s franchisee Superior Star filed Chapter 11 after a 2023 deal revealed unpaid taxes, costly repairs, and lease burdens; plans to reject leases and refocus.
Jul 18, 2026
If your restaurant is busy but profits feel thin, food cost is usually the first place to look. Not because it is always the problem, but because it is the most controllable variable in your P&L.

If your restaurant is busy but profits feel thin, food cost is usually the first place to look. Not because it is always the problem, but because it is the most controllable variable in your P&L. Labor is sticky. Rent is fixed. But food costs respond quickly when you tighten up operations. This blog walks through how to calculate your restaurant food cost percentage correctly, what the numbers actually mean for different types of operations, and the practical steps that move the needle without cutting corners on quality.
Food cost percentage is the share of your food sales revenue that goes toward ingredient costs. It tells you, for every dollar you bring in from food sales, how much you spent on the raw materials to produce it. Most profitable full-service and fast-casual restaurants in the U.S. target a restaurant food cost percentage between 28% and 35%. That range has held up through years of industry data. The National Restaurant Association's 2025 Operations Data Abstract, based on responses from over 900 operators, reported a median food cost ratio of 32.4% among limited-service restaurants and 32.0% for full-service in 2024. But the percentage alone is not a verdict. A 34% food cost at a high-volume steakhouse in Chicago can be perfectly healthy. That same number at a fast-casual sandwich shop in a mid-size market is a problem. Context matters more than the benchmark. What the number tells you is whether ingredient spending is in proportion to what you are charging. When costs drift above your target, it usually points to one of four things- portion sizes are loose, purchasing is not optimized, waste is higher than you think, or menu prices have not kept up with ingredient costs.
The food cost formula is simple math. The challenge is getting the inputs right. Food Cost Percentage = (Cost of Goods Sold / Total Food Sales) x 100 To find your Cost of Goods Sold (COGS), use this- Beginning Inventory + Purchases During the Period - Ending Inventory = COGS Here is how it looks in practice. Say you start a week with $9,000 in inventory. You purchase $6,500 in food during the week. At the end of the week, your remaining inventory is valued at $7,200. Your COGS is $9,000 + $6,500 - $7,200 = $8,300. If your total food sales for that week were $26,500, then- $8,300 / $26,500 x 100 = 31.3% That is a healthy number for most concepts. Apply the food cost formula weekly at a minimum. Monthly calculations are standard in the industry, but weekly tracking catches problems roughly three times faster. A portioning issue you catch in week one costs you far less than one you catch at month-end. A few things that commonly throw off the numbers- Mixing alcohol revenue into food sales is the most frequent error. Keep them separate. Including non-food supplies like paper goods or cleaning materials in your ingredient costs will also distort the figure. And if your beginning inventory count is rushed or inconsistent, everything downstream is wrong.
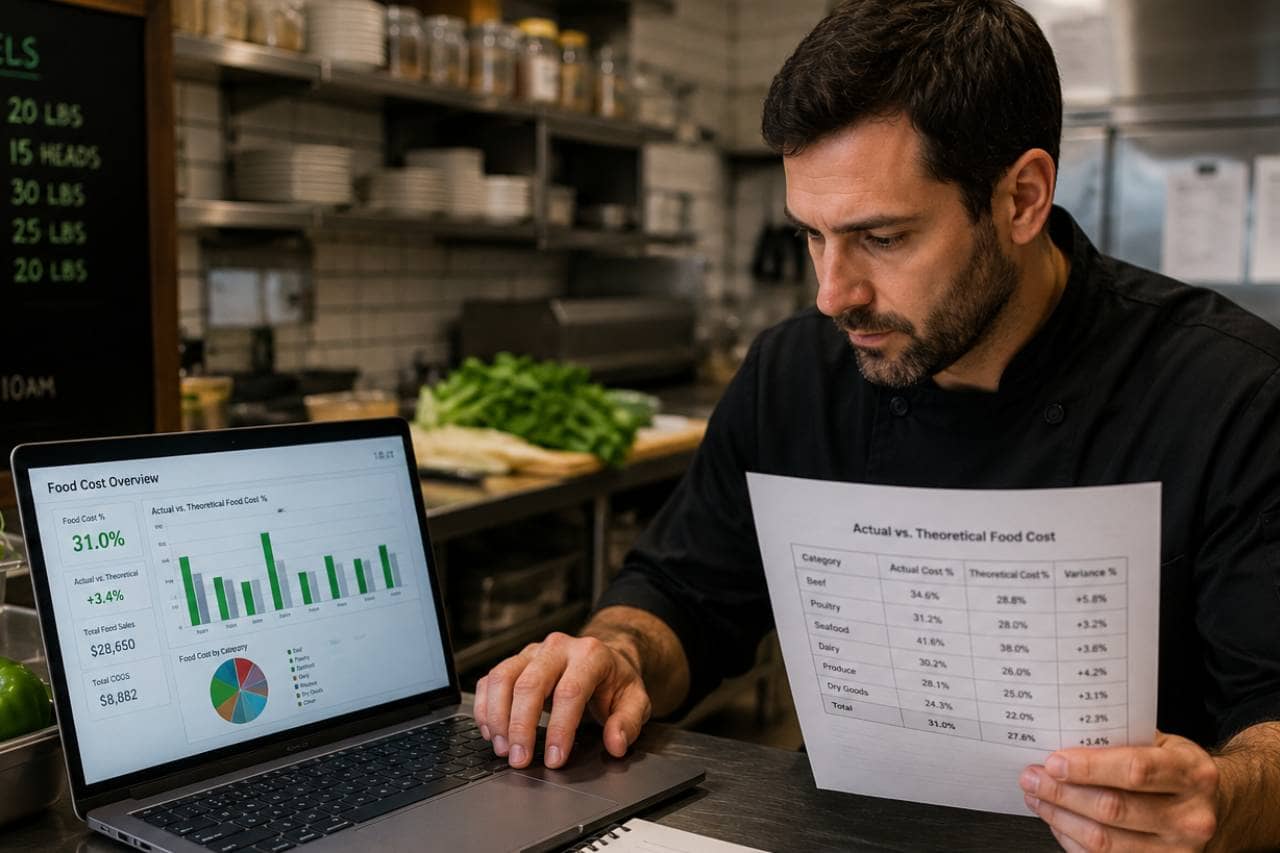
Most blog on restaurant food cost percentage stop at the formula. This is the part they skip, and it is the most useful diagnostic tool you have. Theoretical food cost is what your costs should be based on standardized recipes and actual sales volume. If you sold 40 burgers and your recipe calls for 5 oz of ground beef per burger, your theoretical beef usage is 12.5 lbs. Actual food cost is what you really spent. The gap between the two is where your losses live. A 2% gap between actual and theoretical might sound minor. Across a restaurant doing $1.2 million in annual food sales, that is $24,000 in unaccounted costs every year. That money went somewhere- over-portioning, plate waste, theft, prep errors, or spoilage. Tracking this gap regularly forces the right conversations. If your actual cost runs above theoretical for three weeks in a row on the same station, that is a training issue. If it spikes suddenly, check receiving. If it trends up slowly over time, ingredient prices probably changed, and your recipe costs were never updated. Operators who only track actual food cost are flying with one instrument. The comparison between actual and theoretical is where real cost control happens.

You've probably seen the 2835% range quoted in pretty much every restaurant management blog out there. It's not wrong. It's just too broad to be useful on its own a pizza shop and a steakhouse are playing completely different games, and lumping them into one number hides more than it reveals. Quick-service sits at the tight end, usually 2832%. Standardized menus, centralized prep, and high volume make that kind of consistency possible. There's just less room for things to go sideways. Fast-casual runs a touch higher, typically 2833%. Better ingredients than QSR push the percentage up a bit, but volume keeps it from getting out of hand. Casual dining and full-service restaurants land between 30% and 35%. More complex menus, pricier proteins, more hands-on prep work, it all adds up. Fine dining breaks the pattern completely. Food costs above 35%, sometimes creeping toward 40%, aren't unusual at all. It works because the check size carries the math. Guests are paying for an experience, not just a plate of food. Pizza, oddly enough, tends to be one of the best-performing categories on paper. Dough, cheese, and sauce are cheap, throughput is high, and 1822% food cost is common. Seafood and sushi are the opposite story entirely. Fish prices swing constantly, and shelf life is short, so a lot of operators give up chasing a clean percentage and start tracking gross profit per dish instead.
1. Count Inventory Every Week, Not Once a Month It's tedious, sure. That's exactly why most places skip it or only do it monthly. But weekly counts are the thing everything else depends on. You can't catch a trend, cut waste, or compare actual cost to theoretical cost without numbers that are actually current. Pick a day, pick a time, and ideally have the same person run the walk-in and dry storage counts every week. Consistency matters more than precision here. 2. Actually Follow FIFO. Every Time. First in, first out isn't an accounting formality; it's how you stop product from going bad on the shelf. New stock goes behind old stock, no exceptions. Label everything the moment it comes in. If your receiving area makes rotation a hassle, rearrange it so the easy thing to do and the right thing to do are the same thing. Here's where it usually falls apart- a delivery lands mid-rush, someone shoves it onto whatever shelf is closest, and nothing ever gets rotated. Blocking off one slower afternoon a week just to reorganize the walk-in pays for itself pretty quickly in spoilage you avoid. 3. Standardize Portions, and Then Actually Enforce It Portion drift is one of the quietest, most expensive habits a kitchen can have. The patty's supposed to be 5 ounces. It's a busy Friday, the cook's eyeballing it at 6. Congratulations you just gave away a 20% cost overrun on that order, and nobody noticed. Scales and portion cups shouldn't be optional. It's not only a cost issue, either- guests notice when their burger is smaller than the one they got last visit. 4. Take a Hard Look at Your Low-Margin Items Menu engineering really just means looking at every dish two ways- how often it sells, and how much it actually makes you. The items that sell well and pay well are easy; leave them alone. The ones that sell well but barely make money are the real problem, because you're losing money at volume, not just per plate. For those, there are four real options- raise the price, shrink the portion, simplify the dish to cut labor and ingredient costs, or pull it from the menu. Restaurants hang onto underperformers more often than they should, usually out of habit, or because one regular always orders it. And don't stop at the percentage. Look at the dollars. A $28 dish at 36% food cost still nets $17.92 toward your bottom line. A $10 dish at 28% nets $7.20. The "better" percentage is sometimes the worse deal. 5. Take Food Waste Seriously This might be the single biggest controllable lever in the whole operation, and almost nobody pulls it hard enough. Industry estimates put waste somewhere between 4% and 10% of everything a restaurant buys gone before it ever reaches a guest's plate. Knowing how to reduce food waste starts with measuring it. Keep a waste log at each station. Track prep waste, spoilage, and returned or comped plates separately, because each type has a different root cause and a different fix. Smaller batch preparation reduces waste significantly for products with short shelf lives. If you prep a full pan of a side dish that turns over slowly on Tuesdays, you are generating spoilage. Prep to anticipated cover counts, not to convenience. Use trim and prep scraps creatively. Vegetable trim becomes stock. Bread that did not sell becomes croutons or breadcrumbs. Meat trim goes into staff meals or specials. None of this requires a fine dining menu. It just requires a system. The how to reduce food waste conversation is also a staff training conversation. Kitchen culture matters. Teams that care about waste behave differently than teams that treat overproduction as someone else's problem. 6. Negotiate with Suppliers and Compare Pricing RegularlyLoyalty to one supplier is not always a virtue. Review pricing from at least two to three distributors quarterly. Even small per-unit differences on high-volume items add up fast. Build genuine relationships with your reps. They often know when prices are about to spike and can suggest substitutions or help you lock in pricing before an increase hits. Ask about volume discounts on non-perishables. Ask about end-of-week produce specials. Most operators never ask. When ingredient costs jump due to market conditions, which happens often with proteins, eggs, and certain produce, update your recipe costs immediately. Many operators keep using an old cost figure and wonder why their restaurant food cost percentage keeps creeping up. 7. Track Receiving Accuracy What you ordered and what gets delivered are not always the same. Short weights on proteins, damaged produce that gets checked in without being rejected, and incorrect pricing on invoices are all real sources of cost leakage. Designate someone to verify deliveries against purchase orders every time. Weigh proteins before they go into storage. Push back on anything that does not meet spec. You paid for a product that meets your standards; receiving anything less is a direct cost hit. 8. Cross-Train Staff and Reduce Over-Prep Over-prepping is a habit in restaurants that value "being ready." But prepping five sheet pans of product when you typically move two on a Tuesday night is a waste of creation. Accurate prep forecasting based on historical sales data reduces this without compromising service. Cross-training staff so more team members can produce multiple menu items reduces emergency prep situations. When only one person knows how to make a complex component, the instinct is to always over-prep it as insurance. 9. Review Menu Prices Annually at Minimum Ingredient costs in the U.S. rose meaningfully over the past several years. According to USDA Economic Research Service data, beef and veal prices rose 11.6% in 2025. Egg prices, despite easing in the second half of 2025, averaged 21.9% higher than 2024 levels. If your menu prices have not been adjusted since before those increases, your food cost formula will keep showing a higher percentage regardless of how well you manage waste and portioning. A $0.75 to $1.00 increase on your 10 most popular items, applied thoughtfully, often goes unnoticed by guests and restores margin that was eroded by inflation.
Restaurant management software has gotten considerably more practical over the past few years. Integration between POS systems, inventory platforms, and purchasing tools now allows operators to track theoretical vs. actual food cost automatically rather than doing it manually in spreadsheets. The most useful features are recipe costing that updates automatically when ingredient prices change, and variance reports that show the gap between theoretical and actual usage by item or by station. That kind of visibility used to require a dedicated cost controller in larger operations. Now it is accessible to independent operators. That said, software only works as well as the data going into it. Clean inventory counts, accurate receiving, and consistent recipe documentation have to come first. Operators who invest in technology before getting those basics right usually see disappointing results.
Calculating once a month and reacting instead of tracking weekly and adjusting in real time. By the time you see the monthly number, two or three weeks of problems have already compounded. Using total sales instead of food-only sales in the denominator. If you include beverage or alcohol revenue, your food cost percentage will look artificially low. Not updating recipe costs when ingredient prices change. Your food cost formula produces garbage if the ingredient costs feeding it are six months out of date. Treating food cost percentage as the only metric. Contribution margin, waste percentage, and the actual vs. theoretical gap each tell you something the headline percentage does not. Chasing the benchmark rather than your own target. The 28% to 35% range is useful context, but your target restaurant food cost percentage should be built around your specific concept, pricing strategy, and market.
Food cost management is not a project. It is a weekly operating discipline. The restaurants that run tight food costs do not necessarily have better recipes or more sophisticated software. They count inventory consistently, hold the line on portion standards, update their numbers when costs change, and use the gap between actual and theoretical as a management signal rather than just a math exercise. Start with the basics. Apply the food cost formula weekly. Compare actual to theoretical. Pick two or three waste reduction tactics and build them into standard operating procedure. Then add technology and more sophisticated analysis once the fundamentals are solid. The margin is already in your operation. A consistent process is what gets it into your bank account.