








Food Yield Calculator - How to Calculate Ingredient Yield in Your Restaurant
Learn how to calculate food yield using AP and EP weights, convert it into true ingredient cost, price menus accurately, and reduce kitchen waste.


What Is Food Yield?
Every ingredient that enters your kitchen is heavier, bulkier, and less usable than the portion that eventually lands on a guest's plate. A case of whole pineapples arrives with skins, crowns, and cores. A beef tenderloin comes with silverskin, chain muscle, and fat caps. Even a simple bag of onions loses weight to papery skins and root ends before a single slice hits the pan. Food yield is the measure of how much of what you bought you can actually serve. In practical terms, food yield is the usable amount of an ingredient that remains after it has been trimmed, peeled, boned, portioned, or cooked. It is usually expressed as a percentage of the original weight. If you start with 10 pounds of carrots and end up with 8.5 pounds of peeled, trimmed carrots ready for the pot, your yield is 85 percent. The other 15 percent is trim- product you paid full price for but cannot sell. Accurate yield data supports several decisions that shape your restaurant's profitability - 1. Menu pricing - Plate costs built on true edible-portion costs let you set prices that protect your margins instead of guessing. 2. Purchasing - Comparing suppliers or pack sizes becomes meaningful when you compare cost per usable pound rather than cost per purchased pound. A cheaper whole product can end up costing more than a pricier pre-trimmed one. 3. Portion control - Knowing how much usable product you get from a case helps you forecast how many portions you can produce and how much to order. 4. Consistency - When yields are documented, every cook prepping the same item works toward the same standard, which keeps plate costs and portion sizes steady from shift to shift. Food cost control often gets framed around big levers like negotiating with suppliers or reworking the menu. But many kitchens lose money in quieter ways- through yield assumptions that were never tested, trim that nobody weighs, and recipes costed at invoice price. Learning to calculate food yield gives you a clear, measurable view of what each ingredient truly costs once it is ready to serve.
Key Terms to Know - AP, EP, and Yield Percentage
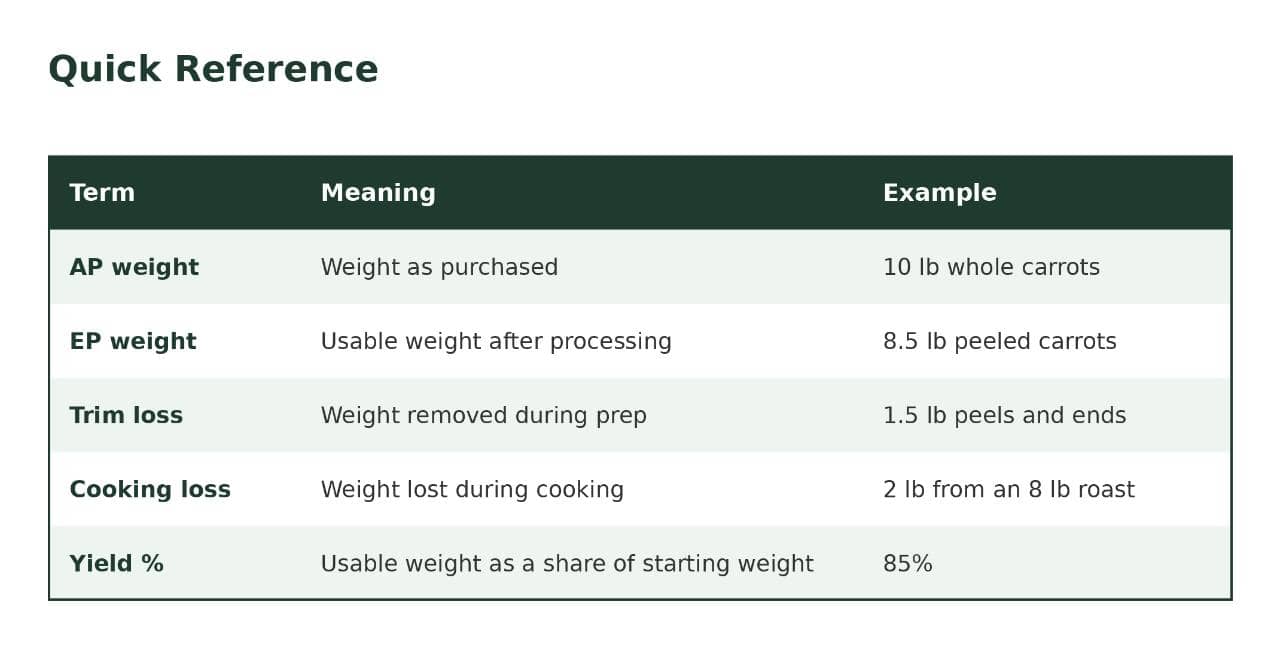
Before working through the formula, it helps to have a shared vocabulary. Kitchens often use these terms loosely, and mixing them up leads to costing errors. The definitions below are the ones used throughout the rest of this article. As Purchased (AP) As Purchased (AP) refers to the ingredient in the exact form and weight you received it from the supplier. This is the number on your invoice and the starting point for every yield calculation. A 10-pound case of whole carrots with tops and dirt, a 14-pound whole pork shoulder with bone and skin, and a 5-pound bag of unpeeled onions are all AP weights. If you paid for it and it arrived at your back door, it is AP. AP cost is what you paid per unit at that stage. If the case of carrots cost $12.00 for 10 pounds, your AP cost is $1.20 per pound. Edible Portion (EP) Edible Portion (EP) is the amount of the ingredient that remains and can actually be served or used in a recipe after processing. It is what is left once you have peeled, trimmed, boned, cored, or otherwise prepared the ingredient. EP can describe the product at different stages, so it is important to specify which one you mean - 1. Trimmed EP - The weight after cleaning and trimming but before cooking (for example, peeled and trimmed carrots, or a portioned raw tenderloin). 2. Cooked EP - The weight after cooking (for example, a roasted pork shoulder, or steamed rice). When you calculate yield, make sure everyone in the kitchen knows which EP stage is being measured. A recipe that calls for "1 pound of chicken breast" means something very different depending on whether that pound is raw or cooked. Trim Loss Trim loss is the weight removed during preparation, before cooking. It includes peels, skins, stems, cores, bones, fat, silverskin, and anything else that gets cut away and discarded (or repurposed). The relationship is straightforward - Trim loss = AP weight - trimmed EP weight If you start with 10 pounds of carrots and end up with 8.5 pounds of usable peeled carrots, your trim loss is 1.5 pounds. Cooking Loss Cooking loss is the weight lost during the cooking process itself, mainly through moisture evaporation and rendered fat. It occurs after trimming and varies with the cooking method, temperature, and time. Cooking loss = trimmed EP weight - cooked EP weight A beef roast that weighs 8 pounds after trimming and 6 pounds after roasting has a cooking loss of 2 pounds. Cooking loss works in the opposite direction for some foods. Rice, pasta, and dried beans absorb water and gain weight when cooked, which results in a yield above 100 percent. Separating trim loss from cooking loss is useful because they have different causes. Trim loss depends on the product and the skill of the prep cook. Cooking loss depends on the method and equipment. Tracking them separately tells you where your losses are happening and which one you can realistically improve. Yield Percentage Yield percentage expresses how much of the starting weight remains after processing. It is the figure that ties all of these terms together and makes different ingredients comparable. At its simplest, it is the usable weight divided by the starting weight, multiplied by 100. Using the carrot example, 8.5 pounds usable from 10 pounds purchased gives a yield percentage of 85 percent. Depending on what you are measuring, you may work with three related figures - 1. Trim yield (or prep yield) - Trimmed EP compared to AP weight. 2. Cooking yield - Cooked EP compared to trimmed EP weight. 3. Total yield - Cooked EP compared to AP weight, which captures every stage from delivery to plate.
The Food Yield Formula Explained
Now that the terms are defined, the math itself is simple. The challenge in most kitchens is not the arithmetic but the consistency of the measurements that go into it. This section covers the core formula, what each variable means, and how to collect accurate weights. The Core Formula The basic food yield formula is - Yield % = (EP weight / AP weight) x 100 - EP weight is the usable weight after processing. - AP weight is the weight you started with, as purchased. - Multiplying by 100 converts the result from a decimal to a percentage. For example, if you start with 20 pounds of whole bell peppers and end up with 15 pounds of cleaned, seeded, and trimmed peppers - 15 / 20 = 0.75 0.75 100 = 75% yield That means 75 percent of what you bought is usable, and 25 percent is lost to stems, seeds, and cores. Working the Formula in Reverse The same formula can be rearranged to answer other practical questions. Two variations come up constantly in kitchen planning. Finding how much to order (AP needed) - AP weight = EP weight needed / Yield % (with yield as a decimal) If a recipe requires 12 pounds of trimmed peppers and your yield is 75 percent - 12 / 0.75 = 16 pounds AP You need to purchase 16 pounds to end up with 12 pounds of usable product. Ordering exactly 12 pounds would leave you short. Finding how much usable product to expect (EP from AP) - EP weight = AP weight x Yield % (with yield as a decimal) If you receive a 30-pound case of peppers with a 75 percent yield - 30 x 0.75 = 22.5 pounds EP This helps you forecast how many portions a delivery will produce. Calculating Loss Percentage Sometimes it is more useful to express the loss rather than the yield. The loss percentage is simply the complement of yield - Loss % = 100 - Yield % Using the pepper example, 100 75 = 25 percent loss. You can also calculate it directly from weights - Loss % = ((AP weight - EP weight) / AP weight) x 100 Either method gives the same result. Use whichever matches the way your team thinks about the product. Combining Trim Yield and Cooking Yield When an ingredient goes through both trimming and cooking, you can calculate each stage separately and then combine them. This is where many costing errors occur, because the percentages must be multiplied, not added. Total yield % = Trim yield % x Cooking yield % (with both as decimals) Suppose you buy a beef roast with a trim yield of 80 percent and a cooking yield of 75 percent - 0.80 x 0.75 = 0.60 = 60% total yield Adding the two losses together (20% + 25% = 45% loss) would suggest a 55 percent yield, which is wrong. The cooking loss applies only to the trimmed weight, not the original weight, so the stages compound rather than stack. How to Record Accurate Weights The formula is only as reliable as the numbers you feed into it. A few habits make a large difference - 1. Use a calibrated scale. A digital kitchen scale that measures in tenths of a pound or in grams is far more reliable than estimating by eye or relying on label weights. Check calibration periodically with a known weight. 2. Weigh at the same stages every time. Always record AP weight before any processing and EP weight at a clearly defined point, such as after trimming but before cooking. 3. Account for packaging and containers. Tare the scale with the empty container, or subtract the weight of the pan, bag, or liner. Weighing a lug of produce with the crate included will inflate your AP weight and understate your yield. 4. Weigh trim separately as a cross-check. If AP weight minus EP weight does not roughly equal the weight of your trim, something is off. Moisture loss, spills, or a weighing error may be the cause. 5. Use a meaningful sample size. Testing a single carrot or one chicken tells you very little. Test a full case or several units, and ideally repeat the test on different deliveries, since natural variation in size and quality affects yield. 6. Have the same person or skill level perform the test. An experienced cook and a new hire will produce different trim results. Testing with the person who normally preps the item gives you figures that reflect real kitchen conditions. Round yield percentages to the nearest whole number or one decimal place, and record the date, product, supplier, and who performed the test. Yields change with seasons, suppliers, and product grades, so a record of when each test was done helps you know when it is time to retest.
How to Calculate Yield Percentage
With the formula and measurement habits covered, this section turns them into a repeatable process any cook or manager can follow. The steps below work for nearly any ingredient, from produce to proteins. The Five-Step Process Step 1. Choose the ingredient and define the end point. Decide exactly what you are testing and what "usable" means. For romaine, is the usable portion whole leaves or chopped? For a pork loin, is it trimmed raw or cooked and sliced? Write the end point down before you begin, so the test reflects how the product is actually used on your menu. Step 2. Weigh the product as purchased (AP). Place the full, unprocessed product on a calibrated scale and record the weight. If it is in a crate, bag, or pan, tare the scale first so you capture only the weight of the food. Note the date, supplier, and pack size. Step 3. Process the ingredient the way your kitchen normally does. Peel, trim, core, bone, or cook it using your standard prep method and the person who normally does the job. Keep the trim in a separate container so it can be weighed afterward. Step 4. Weigh the usable product (EP) and the trim. Weigh the finished, usable portion and record it. Then weigh the trim. The EP weight and the trim weight together should be very close to the original AP weight. A small difference is normal due to moisture loss, but a large gap points to a measuring error. Step 5. Apply the formula. Divide EP weight by AP weight and multiply by 100. Record the result alongside the date, supplier, and name of the person who performed the test. Worked Example 1. Romaine Lettuce A restaurant receives a case of whole romaine hearts and wants to know the yield for a Caesar salad, using chopped, washed, and dried leaves. AP weight. 24 lb (case of whole romaine, tared for the box) Processing. Remove outer leaves, trim the root ends, cut out any brown or damaged sections, then wash and spin dry EP weight. 16.8 lb of usable chopped lettuce Trim weight. 7.0 lb of outer leaves and cores Check. 16.8 + 7.0 =23.8 lb, which is within 0.2 lb of the AP weight. The small gap is reasonable given moisture lost during trimming and washing. Calculation 16.8 / 24 = 0.70 0.70 x 100 = 70% yield If the case cost $36.00, the AP cost is $1.50 per pound. With a 70 percent yield, you are working with only 16.8 pounds of usable lettuce, a point we will use in the costing section to find the true cost per edible pound. Ordering application - If a weekend promotion requires 42 pounds of chopped romaine, you need 42 / 0.70 = 60 pounds AP, or about two and a half cases. Worked Example 2. Carrots A kitchen is testing peeled carrots for a soup base, where the usable portion is peeled and trimmed carrots with tops and ends removed. AP weight. 10 lb bag of whole carrots Processing. Trim tops and tips, peel, and rinse EP weight. 8.5 lb peeled and trimmed carrots Trim weight. 1.45 lb peels and ends Check. 8.5 + 1.45 = 9.95 lb, which is nearly identical to the AP weight. Calculation - 8.5 / 10 = 0.85 0.85 x 100 = 85% yield The loss percentage is 100 - 85 = 15 percent. Forecasting application. If you receive a 50-pound sack, you can expect about 50 0.85 = 42.5 pounds of usable carrots. Many kitchens keep a simple yield test sheet with fields for product name, supplier, date, tester, AP weight, trim weight, EP weight, yield percentage, and notes. Keeping these in a binder or a shared spreadsheet makes retesting quick and builds a reliable reference library over time.
Practical Kitchen Examples Across Ingredient Types
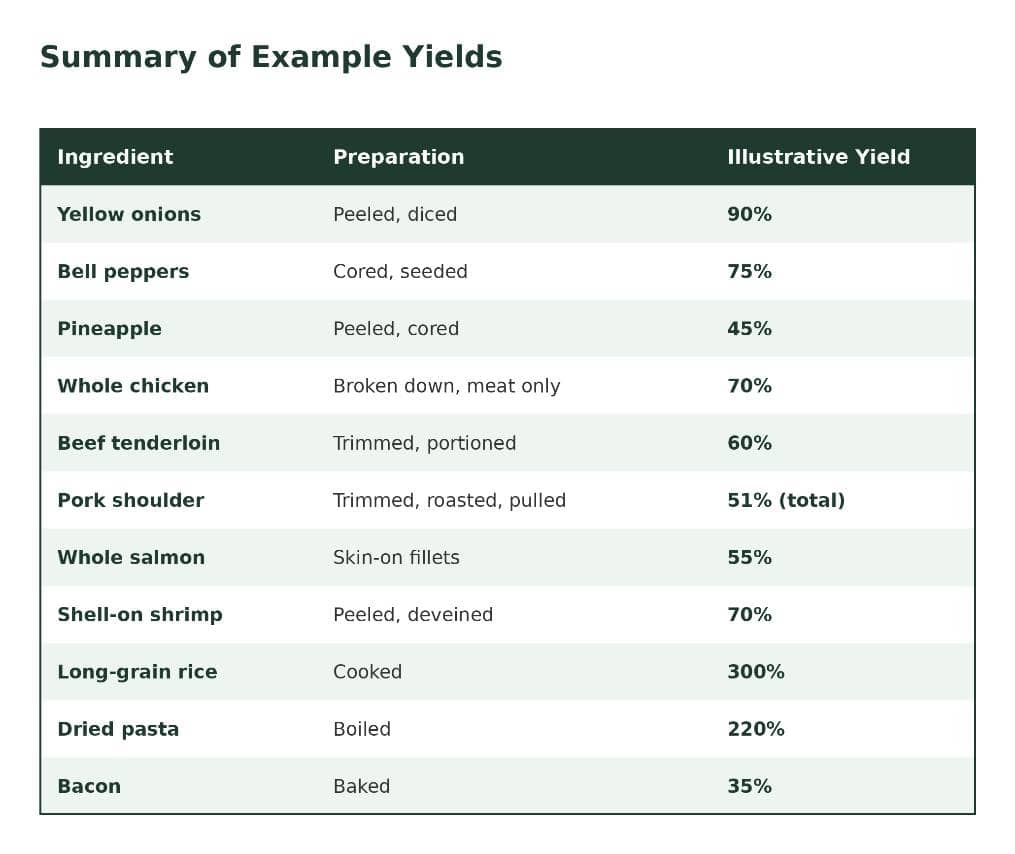
Different ingredients lose weight in different ways. Produce loses it to peels and cores, proteins to bone, fat, and moisture, and starches may actually gain weight. The examples below show how the formula applies across the main categories. The yield figures are illustrative, since results vary with supplier, grade, season, and the skill of your prep cook. Always test your own products before relying on any number. Produce Produce yields depend heavily on how much inedible material the item carries and how aggressively you trim it. Onions (yellow, peeled and diced) AP weight. 25 lb EP weight. 22.5 lb Yield. 22.5 / 25 = 90% Papery skins and root ends are light, so onions tend to have a high yield. Cutting too deeply into the root end or removing extra layers lowers it quickly. Bell peppers (cored and seeded) AP weight. 20 lb EP weight. 15 lb Yield. 15 / 20 = 75% Stems, seeds, and ribs account for the loss. Peppers with irregular shapes or deep lobes can drop below this figure because they are harder to core cleanly. Pineapple (peeled and cored, cut into chunks) AP weight. 12 lb (4 whole pineapples) EP weight. 5.4 lb Yield. 5.4 / 12 = 45% Pineapple is a classic low-yield item. The crown, skin, and core make up more than half of the starting weight. This is where comparing whole fruit against pre-cut product can change your purchasing decision. Meat and Poultry Proteins often involve both trim loss and cooking loss, so it is useful to test each stage. Whole chicken (broken down into usable meat) AP weight. 4 lb Usable meat (breast, thigh, leg, wing, skin on). 2.8 lb Yield. 2.8 / 4 = 70% The carcass, neck, and giblets account for most of the loss. If you make stock from the carcass, that weight is not wasted, but it is not part of the portioned yield either. Beef tenderloin (whole, untrimmed, to trimmed and portioned) AP weight/ 8 lb Trimmed center-cut portions. 4.8 lb Trim yield. 4.8 / 8 = 60% The chain, silverskin, fat cap, and tapered tail reduce the usable weight. Many kitchens find this surprising, which is why tenderloin is a common source of costing errors. The trim can be repurposed into tips, stir-fry, or ground product, but its value should be tracked separately from the premium portions. Pork shoulder (bone-in, roasted for pulled pork) AP weight. 14 lb Trimmed EP (bone and excess fat removed). 11 lb Cooked EP (pulled meat). 7.2 lb Trim yield. 11 / 14 = 78.6% Cooking yield. 7.2 / 11 = 65.5% Total yield. 7.2 / 14 = 51.4% Low and slow cooking renders fat and releases moisture, so the cooking loss is substantial. Costing pulled pork at the raw shoulder price would understate the real cost by nearly half. Seafood Whole fish vs. fillets (for example, a whole salmon) AP weight. 10 lb whole, head-on, gutted Skin-on fillets. 5.5 lb Yield. 5.5 / 10 = 55% Heads, bones, collars, and belly trim account for the rest. Compare this against the price of purchased fillets. If whole fish costs $6.00 per pound, your cost per pound of fillet is $6.00 / 0.55 = $10.91. If the supplier sells skin-on fillets at $11.50 per pound, the gap is much smaller than the invoice prices suggest, and you also save labor. Shell-on shrimp (peeled and deveined) AP weight. 5 lb EP weight. 3.5 lb Yield. 3.5 / 5 = 70% Shells and heads make up the loss. Size grade affects yield, since smaller shrimp have proportionally more shell. Cooked Items Cooked items show why trim loss and cooking loss should be tracked separately. Roasted beef (top round) Trim yield 80 percent, cooking yield 75 percent, total yield 60 percent, as shown in the previous section. Roasting at higher temperatures or for longer times lowers the cooking yield, so standardizing temperature and doneness protects your numbers. Rice (long grain, cooked) AP weight (dry). 5 lb Cooked EP weight. 15 lb Yield. 15 / 5 = 300% Rice absorbs water, so the cooked weight is higher than the dry weight. A yield above 100 percent is normal for starches, and it means a pound of dry rice produces roughly three pounds of cooked rice in this example. Pasta (dried, boiled) AP weight (dry). 10 lb Cooked EP weight. 22 lb Yield. 22 / 10 - 220% Pasta shapes and cook times vary, so a firm al dente yield will differ from a softer, longer cook. Bacon (sliced, baked) AP weight (raw). 10 lb Cooked EP weight. 3.5 lb Yield. 3.5 / 10 = 35% Most of the loss is rendered fat and moisture. If you reserve the rendered fat for cooking, that has value, but it is not part of the portion yield. What These Examples Teach Three patterns stand out. First, items with large inedible parts such as pineapple, whole fish, and bone-in meat have the lowest trim yields, so their invoice price is the least reliable guide to real cost. Second, cooking changes weight in both directions, which means a recipe must always specify whether quantities refer to raw or cooked weight. Third, the same ingredient purchased in different forms, such as whole fish versus fillets, can be compared fairly only once yield is applied. Summary of Example Yields
Calculating True Cost per Edible Portion
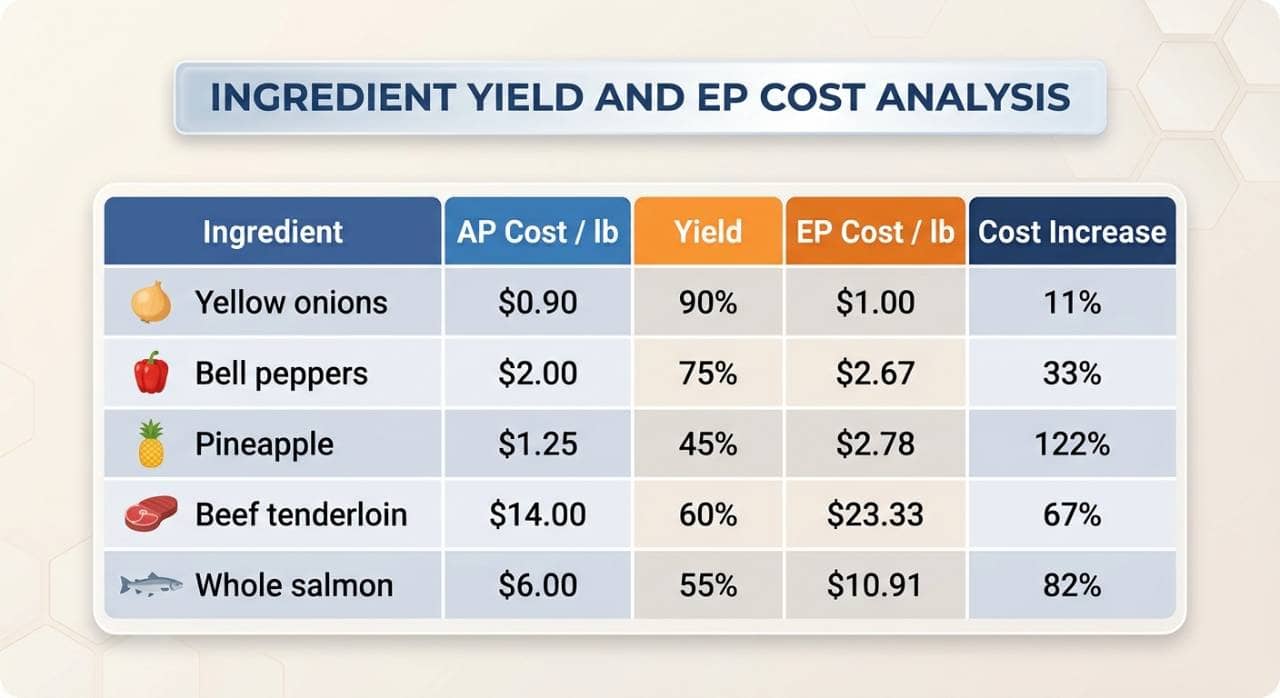
Yield percentage becomes most useful when you convert it into cost. The invoice price shows what you paid for the product as it arrived. The true cost shows what you pay for the portion you can actually serve. Menu pricing, recipe costing, and supplier comparisons should all rest on the second figure. The Core Cost Formula EP cost per unit = AP cost per unit / Yield % (yield as a decimal) If romaine costs $1.50 per pound and your yield is 70 percent, then $1.50 / 0.70 = $2.14 per usable pound. You can also divide total cost by total usable weight- a $36.00 case yielding 16.8 lb gives $36.00 / 16.8 = $2.14. Both methods agree. For recipes, divide by 16 to get cost per ounce- $2.14 / 16 = $0.134. Four ounces of romaine costs $0.54, not the $0.38 the invoice price suggests, a 42 percent understatement for one ingredient. How Yield Changes Cost The lower the yield, the wider the gap between invoice price and true cost - 1. Yellow onions. $0.90 becomes $1.00 per pound at 90 percent yield (up 11 percent). 2. Bell peppers. $2.00 becomes $2.67 at 75 percent (up 33 percent). 3. Beef tenderloin. $14.00 becomes $23.33 at 60 percent (up 67 percent). 4. Whole salmon. $6.00 becomes $10.91 at 55 percent (up 82 percent). 5. Pineapple. $1.25 becomes $2.78 at 45 percent (up 122 percent). Sample Plate Cost- Grilled Chicken Caesar Salad Applying yield to each ingredient gives these plate costs- romaine (4 oz) $0.54, cooked chicken breast (5 oz) $1.54, Parmesan (0.5 oz) $0.30, dressing (2 oz) $0.50, and croutons (1 oz) $0.19. The true plate cost is $3.07. Using invoice prices alone, the same plate calculates to $2.35. That understates the cost by $0.72, about 23 percent of the true figure, mostly because of chicken cooking loss and lettuce trim. Effect on Menu Pricing Menu price equals plate cost divided by target food cost percentage. At a 30 percent target, the invoice-only cost suggests $7.83, while the true cost suggests $10.23. Selling at $7.83 means the real food cost is $3.07 / $7.83 = 39.2 percent, nine points over target. Byproducts and Supplier Comparisons Trim sometimes has value. The conservative approach ignores it and treats it as a bonus. The credit approach subtracts the byproduct's value from the AP cost first. If a $60 salmon yields $4 of usable trim, the net cost is $56, giving $10.18 per pound instead of $10.91. Only credit trim that is actually used. True cost also makes supplier comparisons fair. Whole pineapple at $1.25 per pound with 45 percent yield costs $2.78 per usable pound. Pre-cut at $3.10 with 98 percent yield costs $3.16. The $0.38 gap may disappear once you count prep labor. Keeping Costs Current Recalculate whenever prices change, suppliers or pack sizes switch, seasons shift trim, or a new cook or method changes yield. Review proteins monthly and produce quarterly.
Common Food Yield Calculation Mistakes
Food yield calculations are only useful when the measurements accurately reflect what happens during ingredient preparation. Even small errors in weighing, recording, or interpreting ingredient quantities can lead to inaccurate yield percentages. These mistakes can affect recipe costing, inventory planning, purchasing decisions, and food cost management. Restaurant owners should understand the following common mistakes to maintain reliable food yield measurements. 1. Using Purchased Weight Instead of Usable Weight One of the most common mistakes is calculating recipe costs using the original purchased weight without accounting for preparation losses. Ingredients such as meat, seafood, and vegetables often lose weight during trimming, peeling, and cleaning. Using the purchased quantity as the usable quantity can underestimate ingredient costs. Restaurant operators should always measure ingredients after preparation and use the edible portion weight when calculating recipe expenses. 2. Relying on Estimated Yield Percentages Assuming that every ingredient produces the same yield can create inaccurate calculations. Actual yield percentages may vary depending on ingredient quality, supplier specifications, storage conditions, and preparation methods. For example, two shipments of whole chickens may produce different quantities of usable meat even when they have identical purchased weights. Restaurant owners should measure actual yields instead of relying entirely on standard estimates. 3. Ignoring Differences in Preparation Techniques Different employees may prepare the same ingredient using different trimming, peeling, or cleaning techniques. Excessive trimming can remove usable portions and reduce the amount of food available for recipes. Restaurants should establish standardized preparation procedures and train employees to follow consistent techniques. This helps maintain predictable yields and reduces unnecessary ingredient losses. 4. Failing to Account for Supplier and Ingredient Quality Changes Ingredient quality can influence how much usable food remains after preparation. Changes in meat cuts, vegetable sizes, seafood quality, and supplier specifications may affect yield percentages. Restaurant managers should regularly evaluate incoming ingredients and compare their actual yields against established expectations. This helps identify when supplier changes are increasing preparation losses or ingredient costs. 5. Confusing Food Yield Loss With Avoidable Food Waste Not every ingredient portion removed during preparation represents avoidable food waste. Bones, certain peels, shells, and other inedible portions may naturally be excluded from recipes. However, unnecessary trimming, spoilage, and preparation mistakes can create additional losses. Restaurant owners should distinguish between normal preparation loss and preventable waste to identify where operational improvements are possible. 6. Using Outdated Yield Measurements Ingredient yield percentages can change over time because of seasonal availability, supplier variations, and changes in kitchen preparation procedures. Continuing to use outdated measurements can result in inaccurate recipe costs and purchasing estimates. Operators should periodically recalculate yields for frequently used and high-cost ingredients, especially when supplier specifications or preparation methods change. 7. Failing to Update Recipe Costs Even when restaurants measure ingredient yields correctly, they may forget to incorporate updated measurements into their recipe costing records. This creates a gap between actual ingredient expenses and the costs used for menu pricing decisions. Restaurant owners should review recipe costs whenever significant changes occur in ingredient purchase prices or usable quantities. Keeping these records updated helps ensure menu prices reflect the actual cost of food production. Maintaining accurate food yield calculations requires consistent measurements, standardized preparation procedures, and regular reviews. By avoiding these mistakes, restaurant owners can improve ingredient cost visibility, reduce unnecessary preparation losses, and make more informed operational decisions.
How to Improve Food Yield Tracking and Control Ingredient Costs
Calculating food yield is only the first step toward improving ingredient utilization. Restaurant owners also need consistent tracking procedures to understand how yields change over time and identify opportunities to control preparation losses. By monitoring ingredient measurements, standardizing kitchen procedures, and reviewing purchasing data, operators can make better decisions about food production and ingredient expenses. Here are seven ways restaurant owners can improve food yield tracking and control ingredient costs. 1. Establish Standardized Ingredient Preparation Procedures Create clear preparation guidelines for frequently used ingredients. Specify how employees should trim meat, peel vegetables, clean seafood, and prepare other products before they enter recipes. Standardized procedures help reduce unnecessary trimming and ensure employees follow consistent preparation methods. This also makes yield measurements more reliable because ingredients are processed using the same standards. 2. Train Kitchen Employees to Measure Ingredient Weights Employees responsible for food preparation should understand how to measure purchased and usable ingredient weights accurately. Provide access to calibrated kitchen scales and establish clear instructions for recording measurements. Consistent weighing practices help restaurant managers identify differences between expected and actual yields. Training also helps employees recognize how excessive trimming and improper preparation can increase ingredient costs. 3. Track Yield Percentages for High-Cost Ingredients Not every ingredient requires the same level of monitoring. Restaurant owners should prioritize expensive ingredients and products that experience significant preparation losses. Beef, seafood, poultry, and frequently used produce are good starting points. Record their purchased weights, usable weights, preparation losses, and calculated yield percentages. This information helps operators identify ingredients that have a greater impact on food expenses and require closer attention. 4. Compare Actual Yields Against Expected Yields Establish expected yield percentages for commonly purchased ingredients based on standardized preparation procedures. Compare these benchmarks with actual measurements to identify unusual variations. For example, if a particular cut of beef normally produces an 80% yield but a new shipment produces only 72%, restaurant managers should investigate the difference. Potential causes include supplier quality, changes in product specifications, storage conditions, or inconsistent trimming techniques. Identifying these issues early helps prevent unexpected increases in ingredient costs. 5. Review Supplier Quality and Purchasing Specifications Supplier selection affects more than the purchase price of ingredients. Product consistency, quality, size, and preparation requirements also influence how much usable food restaurants receive. Restaurant owners should compare supplier specifications and evaluate actual ingredient yields rather than choosing products based exclusively on their invoice prices. A slightly more expensive ingredient may provide better value if it produces a higher usable quantity and requires less preparation. 6. Use Inventory Management and Recipe Costing Data Food yield measurements become more valuable when connected with inventory tracking and recipe costing. Inventory records help operators understand how much product enters and leaves the kitchen, while recipe costing data shows how ingredient expenses affect individual menu items. Using these measurements together helps restaurant owners identify discrepancies between expected ingredient usage and actual consumption. For example, if a recipe requires a specific quantity of usable chicken, yield data helps determine how much raw chicken must be purchased to meet production requirements. This supports more accurate purchasing forecasts and reduces the risk of ordering too much or too little inventory. 7. Review Food Yield Performance Regularly Food yield should be monitored as an ongoing operational measurement rather than a one-time calculation. Establish a review schedule for high-cost ingredients and periodically reassess yield percentages when suppliers, ingredient specifications, or kitchen procedures change. Restaurant managers should review preparation losses, compare yield trends, and investigate significant variations. Maintaining historical records also makes it easier to recognize recurring problems and determine whether operational adjustments are improving ingredient utilization. Improving food yield requires accurate measurements and consistent kitchen management. When restaurant owners combine yield tracking with standardized preparation, inventory management, and recipe costing, they gain better visibility into ingredient expenses. These practices help reduce unnecessary losses, improve purchasing decisions, maintain more accurate food costs, and support stronger restaurant profitability.