True Food Kitchen Files Bankruptcy, Closes 12 Sites
True Food Kitchen filed for Chapter 11 bankruptcy, closing 12 locations and shrinking to 34 restaurants across 14 states amid $42.1 million in debt.
News
Oct 5, 2026
True Food Kitchen filed for Chapter 11 bankruptcy, closing 12 locations and shrinking to 34 restaurants across 14 states amid $42.1 million in debt.
Oct 5, 2026

Snooze Eatery names industry veteran Amy Hom as COO, starting Sept. 28, to strengthen hospitality and operations ahead of its next growth phase.
Oct 5, 2026

Opening a second restaurant location requires readiness, clear goals, financial planning, funding, smart strategy, standardized operations, strong teams, and careful launch monitoring for sustainable growth.
Sep 30, 2026

Evaluate restaurant industry performance in Q3 2026 through key trends affecting restaurant sales, traffic, consumer spending, labor, costs, and technology.
Oct 2, 2026
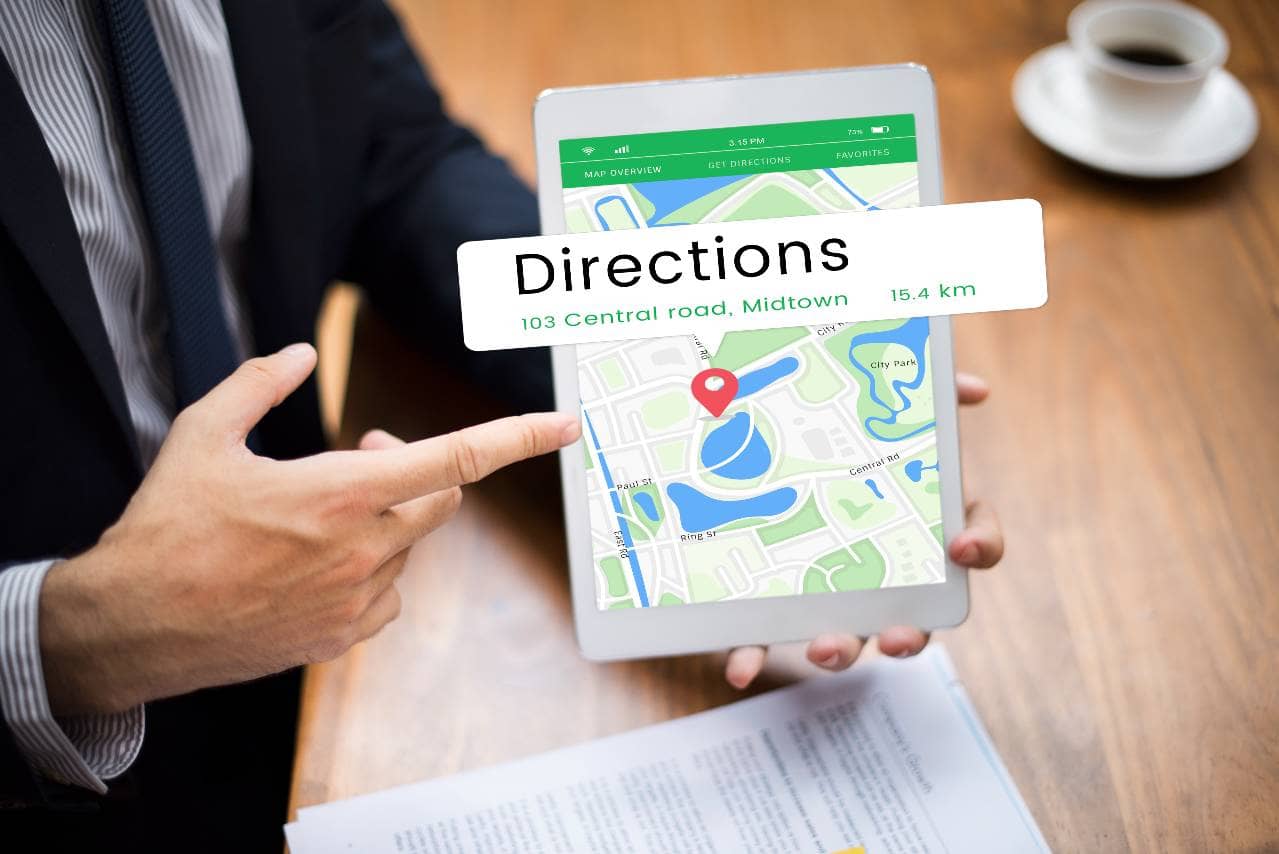
Improve restaurant visibility with local SEO by optimizing Google Business Profile, targeting local keywords, managing reviews, and maintaining accurate online information.
Oct 5, 2026

Restaurants can control operating costs by tracking food, labor, rent, utilities, technology, marketing, and other expenses against sales.
Oct 5, 2026

Understand tip pooling rules, employee eligibility, distribution methods, compliance requirements, recordkeeping practices, and policies restaurant owners need for proper tip management.
Oct 2, 2026

Whit's Frozen Custard hires industry veteran Amos Durbin as COO to guide franchise expansion, drawing on two decades of restaurant leadership experience.
Oct 2, 2026

FAT Brands' $1B acquisition empire fell into bankruptcy and sold for $965M, re-emerging as OHG Brands with 1,700 restaurants.
Oct 1, 2026
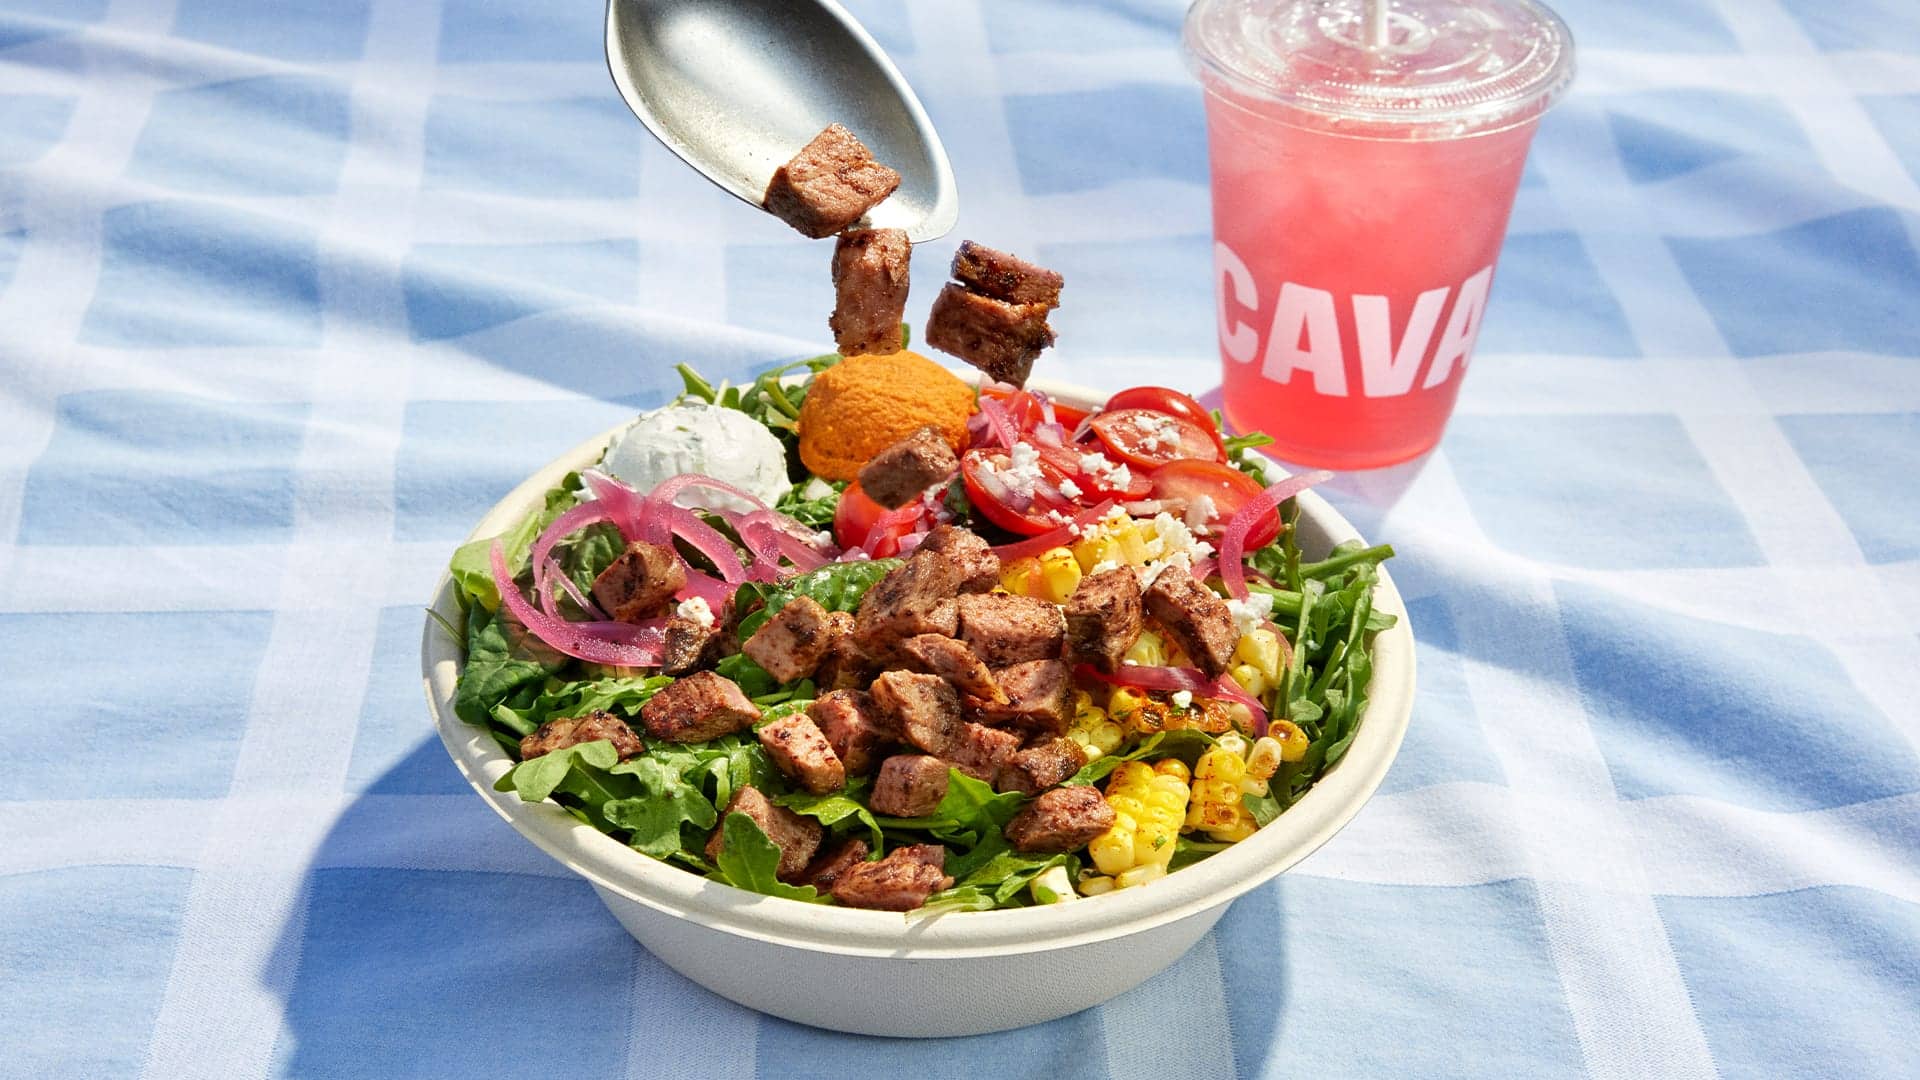
CAVA names John Ludeke, former Dr. Squatch Chief Brand Officer, as its new CMO to drive national growth and guest loyalty.
Oct 1, 2026

Unlock Exclusive Access To Webinars, Events, And The Latest News For Free!
Restaurants can control operating costs by tracking food, labor, rent, utilities, technology, marketing, and other expenses against sales.
Restaurant profitability depends on the relationship between sales, cost of goods sold, labor, occupancy, and other operating expenses. Tracking total expenses in dollars provides a starting point, but measuring each category as a percentage of sales gives restaurant owners a more useful way to evaluate performance. Restaurant expenses can be divided into three primary classifications - fixed, variable, and semi-variable costs. Fixed costs generally remain stable over a defined period, even when sales fluctuate. Examples include rent, insurance premiums, certain software subscriptions, and loan payments. If a restaurant generates $100,000 in monthly sales and pays $10,000 in fixed expenses, those expenses represent 10% of sales for that month. If sales fall to $80,000 while the fixed expense remains $10,000, the same expense rises to 12.5% of sales. Variable costs change as sales or production levels change. Food ingredients, packaging, and some hourly labor expenses are examples. If food costs increase from $28,000 to $32,000 while monthly sales remain at $100,000, the food cost percentage increases from 28% to 32%. Measuring the change as a percentage makes the impact easier to identify than looking at the dollar increase alone. Semi-variable costs contain both fixed and variable components. Utilities are a common example. A restaurant may have a recurring base charge while electricity, gas, or water consumption increases as operating activity increases. Comparing monthly utility expenses with sales and usage data can help identify unusual increases. Restaurant owners should then organize expenses into specific categories for consistent reporting - 1. Food and beverage - Ingredients, beverages, packaging, condiments, and other products used to prepare and serve menu items. 2. Labor - Wages, salaries, overtime, payroll taxes, benefits, and other employee-related expenses. 3. Rent and occupancy - Rent, common-area charges, property-related expenses, and certain maintenance costs. 4. Utilities - Electricity, gas, water, internet, waste management, and related services. 5. Marketing - Advertising, promotions, loyalty programs, social media, digital marketing, and website expenses. 6. Technology - POS systems, payment processing, workforce management software, inventory systems, accounting platforms, and other technology subscriptions. 7. Other operating expenses - Insurance, licenses, permits, repairs, cleaning supplies, uniforms, professional services, and administrative expenses. The value of this breakdown comes from comparing each expense with revenue over time. For example, if sales increase by 5% while labor costs increase by 12%, labor is consuming a larger share of revenue even though sales are growing. Similarly, if food costs increase faster than food sales, the change may indicate higher ingredient prices, purchasing issues, waste, portion-control problems, or changes in menu mix. A restaurant costs breakdown should therefore track both dollar amounts and expense percentages. This allows owners to establish budgets, compare actual spending with planned spending, identify unfavorable cost trends, and determine which expenses are having the greatest effect on profitability.
Food costs are one of the most important expenses for a restaurant because they directly affect menu profitability. These costs include the ingredients and products required to prepare the food and beverages sold to customers. Depending on the concept, they can include meat, seafood, produce, dairy, grains, sauces, spices, beverages, cooking oils, and other ingredients. Packaging, condiments, and disposable items may also need to be tracked separately or included in the restaurant's food-related costs. One of the most useful measurements for managing these expenses is the food cost percentage. It shows how much of a restaurant's sales revenue is being used to pay for the food sold. The basic calculation is - Food Cost Percentage = Cost of Food Sold / Food Sales x 100 For example, if a restaurant spends $30,000 on food used during a period and generates $100,000 in food sales, its food cost percentage is 30%. Monitoring this percentage over time helps identify changes in purchasing costs, menu pricing, portion sizes, and waste. Several operational factors can cause food costs to increase. Ingredient price changes, over-portioning, spoilage, inaccurate inventory counts, theft, and food waste can all reduce margins. Purchasing more inventory than needed can also create unnecessary waste, particularly for products with short shelf lives. Restaurant owners should regularly compare actual food costs with expected costs based on recipes and sales. Standardized recipes and portion specifications can help establish a consistent cost for each menu item. Inventory tracking can then be used to compare what should have been consumed with what was actually used. A consistent approach to purchasing, inventory management, recipe costing, and waste tracking gives restaurant owners better control over food expenses. Rather than looking only at the total amount spent on ingredients, owners can identify which products, menu items, or operational practices are driving food costs and take action accordingly.
Labor is one of the largest ongoing expenses for most restaurants. Managing it requires more than tracking hourly wages because the total cost of labor can include several expenses tied to employing and scheduling staff. Restaurant labor costs include employee wages, salaries, overtime, payroll taxes, benefits, bonuses, and other employee-related expenses. Depending on the restaurant and local requirements, additional costs may include paid time off, employee meals, training, uniforms, and recruitment expenses. A common way to measure labor expenses is the labor cost percentage, which compares total labor costs with restaurant sales - Labor Cost Percentage = Total Labor Costs / Total Sales x 100 For example, if a restaurant spends $25,000 on labor during a month and generates $100,000 in sales, its labor cost percentage is 25%. Tracking this percentage over time can help owners determine whether staffing expenses are increasing faster than revenue. Scheduling has a major influence on labor costs. Overstaffing can create unnecessary payroll expenses, while understaffing can put pressure on employees and affect service quality. Restaurant owners should consider sales patterns, daypart demand, reservations, historical traffic, and expected busy periods when determining staffing levels. Overtime can also significantly affect labor expenses. Employees working beyond applicable overtime thresholds may increase payroll costs, particularly when overtime is not planned. Monitoring schedules and actual hours worked can help managers identify unnecessary overtime and differences between scheduled and worked hours. Labor costs should also be reviewed alongside productivity. A lower labor percentage is not automatically better if it results in slower service or poor operational performance. The goal is to match staffing levels with business demand while maintaining efficient restaurant operations. Regularly reviewing labor costs, schedules, and actual hours gives restaurant owners a clearer understanding of where payroll spending is going. Combining this information with sales data allows owners to make more informed staffing decisions and maintain better control over one of the restaurant's largest operating expenses.

Rent, utilities, maintenance, and other occupancy-related expenses can have a significant effect on a restaurant's cost structure. Because many of these expenses recur every month, restaurant owners should track them separately and measure them against sales. 1. Track Rent and Lease-Related Expenses Rent is typically one of the largest fixed occupancy expenses. However, the actual cost of occupying a restaurant location can extend beyond the base monthly rent. Depending on the lease, restaurant owners may also be responsible for - - Common area maintenance (CAM) charges - Property taxes - Property insurance - Repairs and maintenance - Parking or shared-area expenses - Lease administration fees For example, a restaurant paying $12,000 in monthly occupancy expenses with $100,000 in monthly sales has an occupancy cost of 12% of sales. If sales fall to $80,000 while occupancy expenses remain unchanged, the ratio increases to 15%. The expense has not changed in dollars, but its impact on revenue has increased. 2. Measure Utility Expenses Restaurants use utilities across nearly every part of the operation. Electricity, natural gas, water, internet, and waste services can all contribute to monthly operating costs. Major sources of utility consumption can include - - Refrigeration and freezers - Ovens, fryers, and cooking equipment - HVAC systems - Lighting - Dishwashers - Water heaters - Food preparation equipment Owners should compare utility bills month over month and against sales or operating volume. If electricity expenses increase by 15% while sales increase by only 3%, the difference warrants investigation. Changes in weather, operating hours, equipment performance, or utility rates may explain the increase. 3. Budget for Maintenance and Repairs Maintenance costs should be included in the restaurant's overall occupancy and operating budget. HVAC systems, refrigeration equipment, plumbing, ovens, lighting, and other equipment can require scheduled maintenance or unexpected repairs. Rather than treating every repair as an unexpected expense, restaurant owners can review historical maintenance spending to estimate a recurring budget. This creates a more realistic picture of the cost required to operate each location. 4. Separate Occupancy Costs by Category Combining rent, utilities, maintenance, and other property expenses into one broad category makes it harder to determine what is driving cost increases. Instead, track rent, CAM charges, utilities, repairs, maintenance, and other occupancy expenses separately. This allows owners to compare each category over time and identify specific changes. 5. Compare Occupancy Costs With Sales Dollar amounts alone do not show the full impact of occupancy expenses. Restaurant owners should calculate occupancy costs as a percentage of sales and monitor the ratio over time. Occupancy Cost Percentage = Total Occupancy Costs / Total Sales x 100 For example, if annual occupancy expenses total $144,000 and annual sales are $1.2 million, occupancy costs represent 12% of sales. If sales decline to $1 million while occupancy expenses remain at $144,000, the ratio rises to 14.4%. This analysis helps restaurant owners understand whether occupancy expenses are becoming a larger burden relative to revenue and provides a stronger basis for budgeting, lease evaluation, and location-level financial decisions.
Marketing and technology expenses have become important parts of restaurant operating budgets. While these costs may not be directly tied to preparing food or paying employees, they can influence customer acquisition, retention, ordering, scheduling, reporting, and other areas of restaurant operations. Marketing expenses can include digital advertising, social media management, email campaigns, loyalty programs, website management, promotional materials, and local advertising. Restaurants may also spend money on photography, content creation, search engine optimization, online ordering promotions, and other activities designed to attract customers. Restaurant owners should track marketing expenses separately and compare spending with business objectives. A marketing budget should account for both recurring expenses, such as advertising subscriptions, and campaign-specific expenses, such as promotional campaigns or seasonal advertising. Technology is another growing expense category. Restaurants may use technology across many areas of the business, including point-of-sale systems, payment processing, workforce management, inventory management, accounting, online ordering, customer loyalty, and reporting. Technology costs can include software subscriptions, hardware purchases, implementation fees, maintenance, integrations, and payment processing charges. Some expenses are fixed monthly subscriptions, while others may increase based on transaction volume, locations, employees, or usage. It is useful to separate one-time technology costs from recurring technology expenses. Purchasing POS hardware, for example, may represent a significant upfront expense, while software licenses or support services may create ongoing monthly or annual costs. Restaurant owners should also evaluate technology expenses based on how they support business operations. A system that reduces manual work, improves scheduling accuracy, strengthens inventory visibility, or provides better financial reporting may provide operational value beyond its direct cost. Tracking marketing and technology expenses separately gives owners a clearer view of how much is being invested in customer acquisition and operational infrastructure. Reviewing these expenses regularly can help identify unused subscriptions, unnecessary services, duplicate systems, and opportunities to improve the overall restaurant cost structure.
Not every restaurant expense fits neatly into food, labor, rent, utilities, marketing, or technology. General operating expenses cover the additional costs required to keep the restaurant running each day. Although individual expenses may appear relatively small, they can add up to a significant amount over time. Common operating expenses include insurance, licenses, permits, cleaning supplies, uniforms, smallwares, office supplies, repairs, maintenance, professional services, and employee training. Restaurants may also have expenses for accounting, legal services, pest control, security, laundry, waste removal, and equipment servicing. Payment processing is another expense that should be monitored. Restaurants that accept credit and debit card payments typically pay processing fees based on transactions. Delivery platforms and online ordering services may also create commissions or service fees, depending on the restaurant's setup. It is important to distinguish between essential and discretionary operating expenses. Essential expenses are necessary to maintain daily operations, safety, and compliance. Discretionary expenses may include optional services, promotional purchases, or subscriptions that can be adjusted when financial priorities change. Small recurring expenses deserve particular attention. A subscription, supply order, or service contract that costs only a modest amount each month can represent a substantial annual expense when combined with other recurring charges. Reviewing these expenses regularly can help identify services that are no longer being used or expenses that can be reduced. Restaurant owners should organize these expenses into consistent categories rather than placing everything under a broad "miscellaneous" label. A detailed expense structure makes it easier to determine where money is going, how costs are changing, and which areas require attention. Maintaining accurate records of operating expenses also improves budgeting and financial reporting. When owners can see the full range of costs required to operate the restaurant, they can create more realistic budgets and better understand the relationship between revenue, expenses, and profitability.

Looking at restaurant expenses only in dollar amounts does not always provide enough information to determine whether costs are under control. A restaurant that spends more in one month than another may simply have generated more sales. Comparing expenses with revenue provides a clearer picture of how efficiently the restaurant is operating. Cost percentages show how much of restaurant revenue is being used for different expenses. Common measurements include food cost percentage, labor cost percentage, occupancy costs, operating expenses, and prime cost. Prime cost is particularly useful because it combines the two major controllable expenses in a restaurant - Prime Cost = Cost of Goods Sold + Total Labor Costs Comparing prime cost with sales helps owners understand how much revenue is being consumed by food, beverage, and labor expenses before other operating costs are considered. Restaurant owners can also calculate individual expense percentages using a simple formula - Expense Percentage = Expense / Total Sales x 100 For example, if monthly sales are $100,000 and labor costs are $25,000, the labor cost percentage is 25%. Tracking this measurement from month to month makes it easier to identify significant changes in labor spending relative to revenue. Cost structures can vary depending on the type of restaurant. Quick-service restaurants, fast-casual concepts, casual dining restaurants, and full-service restaurants may have different staffing models, food costs, occupancy requirements, and operating expenses. As a result, restaurant owners should consider their business model when evaluating cost percentages rather than relying on a single benchmark. Percentage analysis is also useful for identifying trends. If sales increase while a particular expense grows at a slower rate, that expense may represent a smaller percentage of revenue. Conversely, an expense that grows faster than sales may require further investigation. Regularly reviewing expenses as percentages of sales gives restaurant owners a more meaningful way to evaluate financial performance. It helps identify cost increases, measure changes over time, and determine which areas may need closer management.