True Food Kitchen Files Bankruptcy, Closes 12 Sites
True Food Kitchen filed for Chapter 11 bankruptcy, closing 12 locations and shrinking to 34 restaurants across 14 states amid $42.1 million in debt.
News
Oct 5, 2026
True Food Kitchen filed for Chapter 11 bankruptcy, closing 12 locations and shrinking to 34 restaurants across 14 states amid $42.1 million in debt.
Oct 5, 2026

Snooze Eatery names industry veteran Amy Hom as COO, starting Sept. 28, to strengthen hospitality and operations ahead of its next growth phase.
Oct 5, 2026

Evaluate restaurant industry performance in Q3 2026 through key trends affecting restaurant sales, traffic, consumer spending, labor, costs, and technology.
Oct 2, 2026

Improve restaurant visibility with local SEO by optimizing Google Business Profile, targeting local keywords, managing reviews, and maintaining accurate online information.
Oct 5, 2026

Opening a second restaurant location requires readiness, clear goals, financial planning, funding, smart strategy, standardized operations, strong teams, and careful launch monitoring for sustainable growth.
Sep 30, 2026

Restaurants can control operating costs by tracking food, labor, rent, utilities, technology, marketing, and other expenses against sales.
Oct 5, 2026

Understand tip pooling rules, employee eligibility, distribution methods, compliance requirements, recordkeeping practices, and policies restaurant owners need for proper tip management.
Oct 2, 2026

Whit's Frozen Custard hires industry veteran Amos Durbin as COO to guide franchise expansion, drawing on two decades of restaurant leadership experience.
Oct 2, 2026

FAT Brands' $1B acquisition empire fell into bankruptcy and sold for $965M, re-emerging as OHG Brands with 1,700 restaurants.
Oct 1, 2026
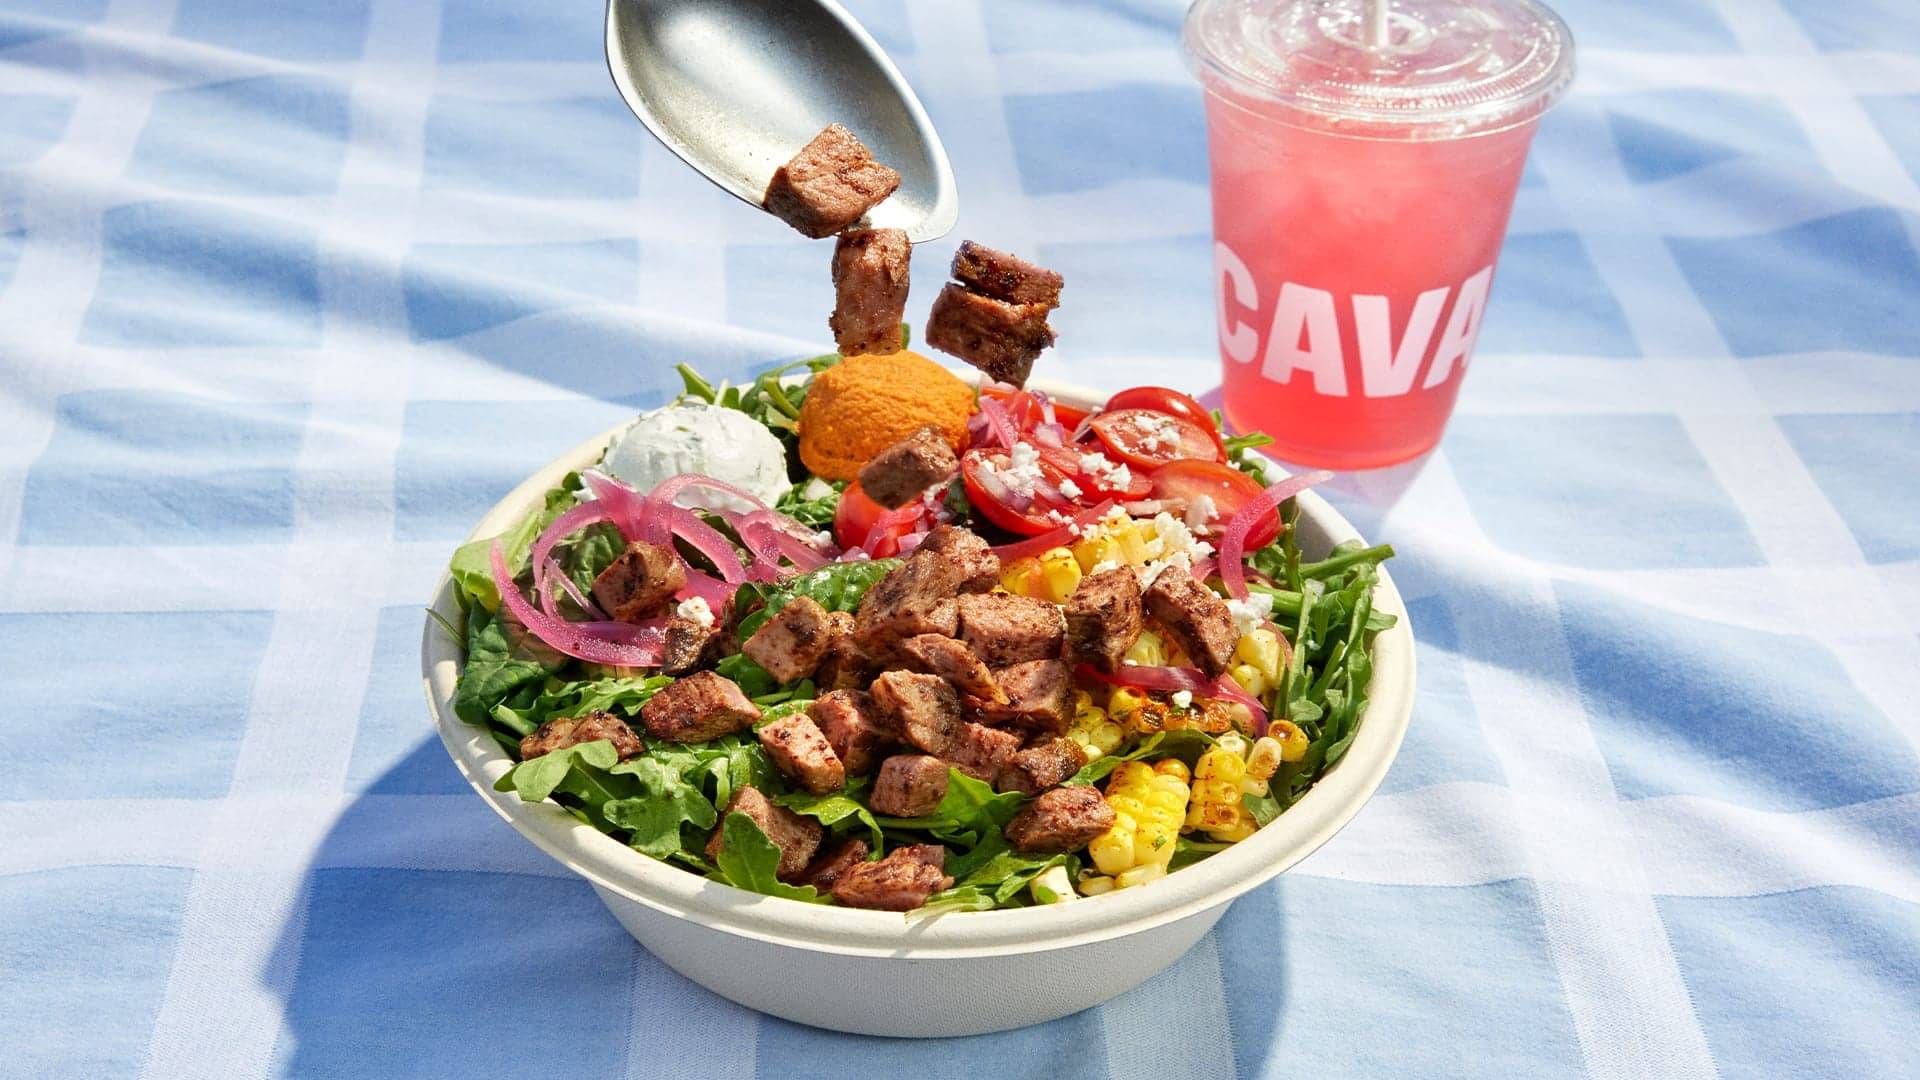
CAVA names John Ludeke, former Dr. Squatch Chief Brand Officer, as its new CMO to drive national growth and guest loyalty.
Oct 1, 2026

Unlock Exclusive Access To Webinars, Events, And The Latest News For Free!
Learn how average inventory is calculated and use inventory data to identify purchasing trends, manage stock levels, and reduce waste.

Average inventory is the average value of the inventory a restaurant holds during a specific period. It gives restaurant owners a clearer view of typical inventory levels than looking at inventory at only one point in time. The basic concept is simple. A restaurant starts a period with a certain inventory value and ends the period with another value. The average inventory calculation uses both figures to estimate the typical inventory level during that period. For example, suppose a restaurant begins the month with $12,000 in inventory and ends the month with $10,000. The average inventory is $11,000. This provides a more representative measurement than looking only at the $12,000 beginning balance or the $10,000 ending balance. Average inventory can be used to evaluate different types of restaurant inventory, including - 1. Food ingredients - Meat, produce, dairy, dry goods, and other ingredients 2. Beverages - Beer, wine, liquor, soft drinks, and mixers 3. Packaging - Takeout containers, cups, bags, and disposable supplies 4. Operating supplies - Cleaning products, paper products, and other consumables Tracking average inventory helps restaurant owners understand how much stock is typically being held and provides a useful measurement for evaluating purchasing and inventory management. It can also be used alongside other metrics, such as food cost percentage and inventory turnover, to identify changes in inventory efficiency. The calculation is particularly useful when inventory levels fluctuate throughout the month. Instead of relying on a single inventory count, restaurant owners can use beginning and ending values to create a simple average that supports more consistent analysis.
Before calculating average inventory, restaurant owners need two numbers - beginning inventory value and ending inventory value. These figures provide the foundation for the calculation, so accuracy and consistency are important. Beginning inventory is the total value of inventory available at the start of the period being measured. For a monthly calculation, this is typically the inventory value recorded at the beginning of the month. It may include food ingredients, beverages, packaging, and other inventory categories the restaurant tracks. Ending inventory is the total value of inventory remaining at the end of the same period. For a monthly calculation, the restaurant counts and values its inventory at the end of the month. For example - Beginning inventory. $15,000 Ending inventory. $13,000 The two figures must cover the same inventory categories and the same measurement period. If beginning inventory includes food and beverages but ending inventory includes only food, the resulting average will not accurately represent inventory levels. Restaurant owners should also use a consistent method for valuing inventory. If inventory is recorded at cost, both beginning and ending inventory should generally be valued using the same basis. Consistent valuation makes comparisons more meaningful from one period to the next. Accurate physical inventory counts are also important. Count quantities carefully, record units consistently, and account for inventory received or removed before finalizing the period's ending count. Once the beginning and ending inventory values are available, the calculation itself is straightforward. These two numbers can then be used in the average inventory formula to determine the restaurant's average inventory for the period.
Once the beginning and ending inventory values are available, restaurant owners can calculate average inventory using a simple formula - Average Inventory = (Beginning Inventory + Ending Inventory) / 2 The formula uses two inventory values from the same period. The beginning inventory represents what the restaurant had at the start of the period, while ending inventory represents what remained at the end. For example, assume a restaurant has - Beginning inventory. $14,000 Ending inventory. $10,000 The calculation is - Average Inventory = ($14,000 + $10,000) / 2 Average Inventory = $24,000 / 2 Average Inventory = $12,000 The restaurant's average inventory for that period is $12,000. The formula works because it takes the midpoint between the beginning and ending inventory values. If inventory levels remain relatively stable throughout the period, this provides a straightforward estimate of the restaurant's typical inventory value. Restaurant owners can apply the formula to different periods depending on how frequently inventory is tracked. A restaurant might calculate average inventory monthly for financial analysis or use shorter periods when more frequent inventory monitoring is needed. The most important requirement is consistency. Beginning and ending inventory should represent the same categories, valuation method, and measurement basis. Using inconsistent numbers can make the calculation misleading and make it difficult to compare inventory performance across periods.

Calculating average inventory does not require a complicated process. Restaurant owners can complete the calculation by following a few basic steps and using accurate inventory values from the same period. Step 1. Determine the Beginning Inventory Start by identifying the total inventory value at the beginning of the period. Suppose a restaurant begins the month with $18,000 worth of food, beverages, packaging, and other tracked inventory. Beginning inventory = $18,000 Step 2. Determine the Ending Inventory Next, conduct the inventory count at the end of the same month and determine the total value of the remaining inventory. For example - Ending inventory = $14,000 Step 3. Add the Two Inventory Values Add the beginning and ending inventory values together - $18,000 + $14,000 = $32,000 Step 4. Divide the Total by Two Divide the combined value by two - $32,000 / 2 = $16,000 The restaurant's average inventory is $16,000 for the period. Step 5. Record and Compare the Result Record the average inventory alongside other restaurant financial and operational metrics. Repeating the calculation consistently allows restaurant owners to compare inventory levels between periods. For example, if average inventory increases from $16,000 to $20,000 while sales remain relatively stable, the change may warrant a closer review of purchasing patterns, stock levels, waste, or slow-moving inventory. The calculation itself is simple, but the value comes from using accurate numbers consistently over time. Regular calculations can help restaurant owners identify inventory trends and determine whether stock levels align with operational needs.
Restaurant inventory is not limited to food ingredients. Depending on the operation, a restaurant may track beverages, packaging, cleaning supplies, and other items. Calculating average inventory by category can provide more detailed insight into where inventory is being held. 1. Food and Ingredient - Food inventory typically represents a significant portion of a restaurant's stock. Track ingredients such as meat, seafood, produce, dairy, frozen products, and dry goods. Calculate beginning and ending values using the same categories and valuation method. For example, if food inventory starts at $9,000 and ends at $7,000 - Average food inventory = ($9,000 + $7,000) / 2 = $8,000 2. Beverages and Bar Inventory - Restaurants with beverage programs can separately calculate average inventory for beer, wine, spirits, soft drinks, mixers, and other beverage products. Separating beverage inventory can make it easier to monitor changes in stock levels and purchasing patterns. 3. Packaging and Takeout Supplies - Takeout containers, cups, lids, bags, utensils, and other packaging materials can also be tracked as inventory. This can be particularly useful for restaurants with significant takeout or delivery sales. 4. Cleaning and Operating Supplies - Some restaurants also maintain stock of cleaning chemicals, paper products, gloves, and other operating supplies. Tracking these categories separately can help identify unusual increases in purchasing or stock levels. Why Category-Level Calculations Matter A single average inventory figure provides an overall view, but category-level calculations can reveal where inventory changes are occurring. For example, total inventory may remain stable while food inventory decreases and beverage inventory increases. Restaurant owners can calculate average inventory for individual categories and then use those figures alongside the overall inventory value. This creates a more detailed view of inventory levels and can support purchasing, storage, and inventory control decisions.
Calculating average inventory is only useful if the result helps restaurant owners understand what is happening with stock. Once average inventory is calculated consistently, it can be compared across different periods to identify changes in purchasing, storage, and inventory usage. 1. Identify Changes in Inventory Levels - Compare average inventory from one period to another. A significant increase may indicate higher purchasing levels, slower inventory movement, or changes in operating requirements. A decrease may reflect lower purchasing, stronger inventory usage, or changes in sales volume. The number should be evaluated alongside sales and purchasing data rather than viewed on its own. 2. Identify Potential Overstocking - Higher average inventory can mean more capital is tied up in stock. For perishable ingredients, excessive inventory can also increase the risk of spoilage and waste. Tracking average inventory over time can help restaurant owners identify categories that consistently remain higher than operational needs. 3. Support Purchasing Decisions - Average inventory provides another data point when reviewing purchasing patterns. If inventory levels consistently rise while sales remain relatively stable, purchasing quantities and order frequency may need closer review. Restaurant owners can use these trends to establish more informed purchasing practices based on actual inventory movement. 4. Monitor Inventory Efficiency - Average inventory can also be used with other metrics, including inventory turnover and food cost percentage. These measurements provide different perspectives on how inventory moves through the restaurant. For example, average inventory shows the typical amount of stock being held during a period, while inventory turnover examines how frequently inventory is used or replaced. 5. Track Trends Over Time - A single calculation provides limited insight. Repeating the calculation weekly, monthly, or according to the restaurant's inventory schedule creates a historical record that can reveal trends. Average inventory provides a simple measurement that can help owners evaluate whether inventory levels are aligned with actual business activity.

The average inventory formula is simple, but inaccurate inventory data can produce an unreliable result. Restaurant owners should establish consistent counting and valuation practices to make average inventory calculations more useful. 1. Using Different Inventory Periods - Beginning and ending inventory must correspond to the same measurement period. Using a beginning inventory value from one month and an ending value from a different period can distort the calculation. 2. Mixing Valuation Methods - Beginning and ending inventory should be valued using a consistent method. Switching between different valuation approaches can make the average difficult to interpret and can affect comparisons between periods. 3. Relying on Inaccurate Inventory Counts - An incorrect physical count directly affects the inventory value. Missing items, duplicate counts, incorrect quantities, or unit-of-measure errors can all lead to inaccurate results. Create a consistent counting process and make sure employees understand how products should be counted and recorded. 4. Leaving Out Inventory Categories - If beginning inventory includes food, beverages, and packaging but ending inventory includes only food and beverages, the calculation will not provide a consistent comparison. Define which inventory categories are included before beginning the calculation and use the same categories for both counts. 5. Ignoring Inventory Adjustments - Inventory can change because of waste, spoilage, transfers, damaged products, or counting corrections. These adjustments should be properly recorded so inventory records remain accurate. 6. Calculating Without Reviewing the Trend - Average inventory should not be treated as an isolated number. Compare results across consistent periods and review significant changes alongside sales, purchasing, food costs, and inventory usage. Avoiding these mistakes helps restaurant owners produce more reliable average inventory calculations and makes the metric more useful for ongoing inventory management.