




Actual vs. Theoretical Food Cost - A Complete Guide for Restaurant Owners
Actual food cost measures real usage - theoretical shows the ideal. Comparing them reveals variance, its causes, and strategies like portion control, tighter purchasing, training, and software.

The Importance of Food Cost Accuracy
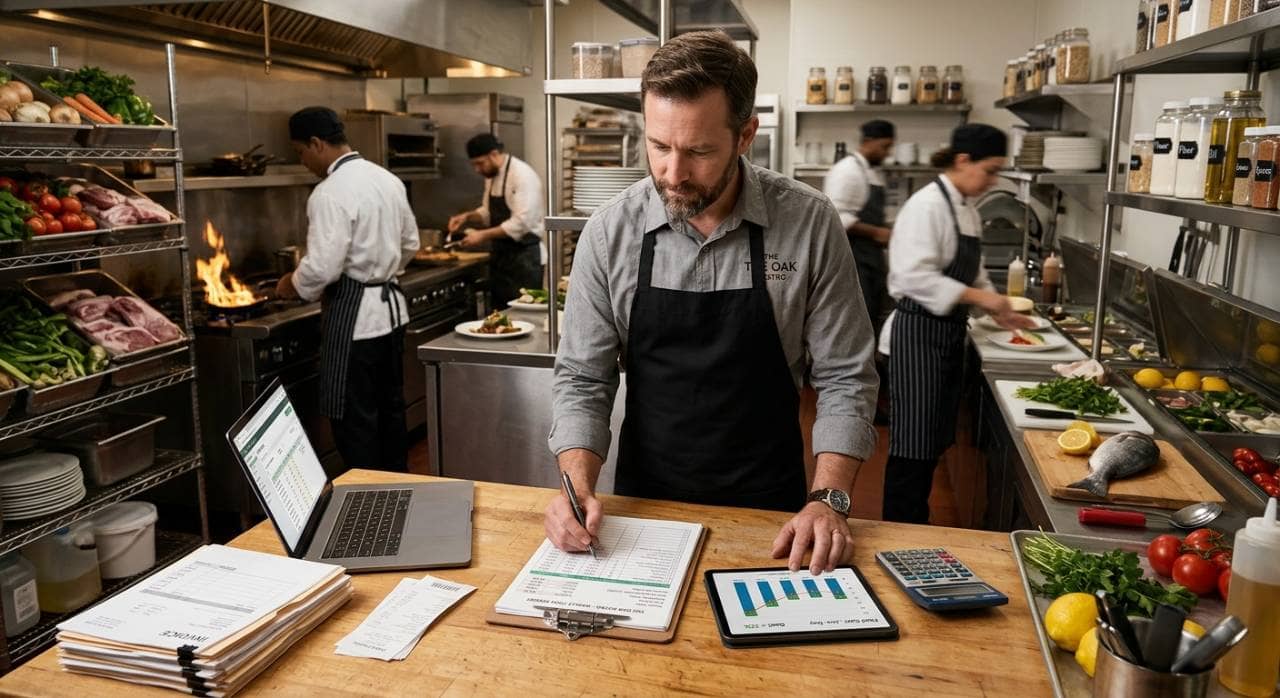
Food is usually the largest controllable expense in a restaurant. Most operators aim to keep food cost somewhere in the range of 28% to 35% of food sales, depending on concept and menu. Within that range, a swing of just a few percentage points can decide whether a month ends in profit or in a squeeze. Restaurant margins are already thin, so even small, unnoticed leaks add up quickly. Many owners track food cost with a single number - the percentage they calculate at the end of the month from inventory and purchases. That figure is useful, but it tells you only what happened, not what should have happened. If your food cost comes in at 34%, you can't tell whether that's a healthy result for your menu or a sign that you're losing money to over-portioning, waste, or theft. One number, standing alone, has no point of comparison. That is where the distinction between actual and theoretical food cost comes in. Actual food cost reflects what your kitchen really used, including every spilled sauce, trimmed vegetable, and unrecorded giveaway. Theoretical food cost reflects what you should have used if every dish had been made exactly to recipe and sold at menu price. The difference between the two, known as variance, shows you how much money is slipping away and gives you a starting point for finding out why. Understanding both measures lets you move from reacting to problems to catching them early. Accurate food cost data supports better pricing decisions, tighter purchasing, more consistent portioning, and more confident menu planning.
Defining Actual Food Cost
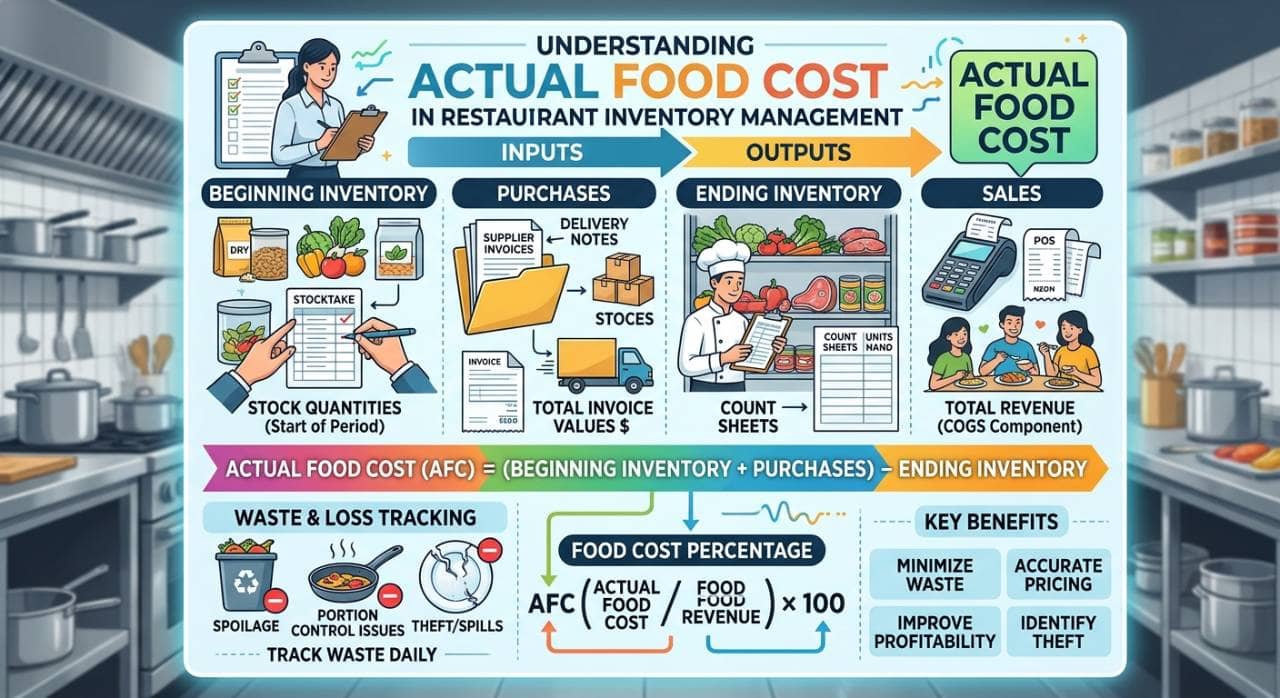
Actual food cost is the real cost of the food your restaurant consumed during a specific period, expressed either as a dollar amount or as a percentage of food sales. It answers a simple question - how much did we actually spend on the ingredients that left our inventory? What Actual Food Cost Measures Unlike a projection or an estimate, actual food cost is based on what physically moved through your kitchen. Every ingredient that was used, wasted, spoiled, dropped, over-portioned, given away, or stolen is captured in this number. That is both its strength and its limitation. It gives you an honest picture of your true spending, but it doesn't explain why the number is what it is. A high actual food cost could come from rising supplier prices, sloppy portioning, heavy waste, or a combination of all th ree. How It Reflects Real Inventory Usage Actual food cost captures everything that reduces your inventory, whether or not it ended up on a guest's plate. Consider what is included - - Food sold to guests, prepared according to recipe - Excess portions that went beyond the recipe specification - Trim and prep waste beyond what your recipes account for - Spoilage and expired product - Cooking errors and remakes - Staff meals and unrecorded comps - Theft or unaccounted-for loss Because it includes all of these, actual food cost is sometimes called the real or true food cost. It is the number your accountant will see reflected in your profit and loss statement, and it is the one that directly affects your bottom line. Where the Data Comes From Calculating actual food cost depends on three inputs, all of which come from your own records - 1. Beginning inventory - the value of all food on hand at the start of the period, taken from your last inventory count. 2. Purchases - the total cost of food bought during the period, drawn from supplier invoices and receiving records. 3. Ending inventory - the value of all food on hand at the end of the period, taken from a fresh physical count. Adding purchases to beginning inventory gives you the total food available for use. Subtracting ending inventory leaves the cost of what was actually consumed. Dividing that figure by food sales converts it into the percentage most operators use to evaluate performance. Because the result is only as reliable as these three inputs, accuracy matters at every step. Unrecorded deliveries, invoices that were never entered, or a rushed inventory count will all distort the final number. A few common weak points to watch - - Inconsistent counting methods, such as estimating partial cases one month and weighing them the next - Missing or late invoices that leave purchases understated - Inventory taken at different times of day, which can skew period comparisons - Unpriced or outdated item costs in your inventory sheet Reliable actual food cost starts with disciplined, repeatable counting and record-keeping. Once you trust this number, you have a solid foundation for comparing it against its counterpart, theoretical food cost.
Defining Theoretical Food Cost
Theoretical food cost, sometimes called ideal food cost, is what your food cost should be if every dish were prepared exactly to recipe, portioned precisely, and sold with zero waste, theft, or error. Where actual food cost tells you what happened, theoretical food cost tells you what was supposed to happen. What Theoretical Food Cost Represents Think of theoretical food cost as the best-case scenario built from your own menu. It is calculated from the cost of the ingredients in each recipe and the number of each item you sold during the period. Because it assumes perfect execution, it is not a number you will hit exactly every time. Its purpose is to set a standard against which real performance can be measured. It is also a useful reflection of your menu's design. A menu loaded with high-cost proteins will carry a higher theoretical food cost than one built around lower-cost, high-margin items, regardless of how well the kitchen performs. That makes theoretical food cost a lens on both pricing and menu structure, not only on kitchen discipline. What It Relies On Three inputs drive the theoretical calculation - 1. Recipe costing - the cost of every ingredient in a dish, based on current supplier prices and the exact quantities the recipe specifies. This includes the small items that are easy to overlook, such as oils, garnishes, and sauces. 2. Portion sizes - the standardized amount of each ingredient or finished item served to the guest. If a recipe calls for a 6-ounce portion, the theoretical cost assumes exactly 6 ounces every time. 3. Sales mix - the quantity of each menu item sold during the period, typically pulled from your point of sale (POS) system Selling more of a high-cost dish and fewer low-cost ones will raise your theoretical food cost even if nothing else changes. Since these inputs change, theoretical food cost is not a fixed figure. Supplier prices shift, recipes get adjusted, and guests order differently from week to week. For the number to stay meaningful, recipe costs must be updated regularly and the POS must be set up so that every menu item, modifier, and combo is linked to the correct recipe. Why It Serves as a Performance Benchmark Theoretical food cost gives you the point of comparison that a single actual figure lacks. When you place the two side by side, the gap between them reveals how closely your kitchen is following its own standards. - A small gap suggests recipes are being followed, portions are consistent, and waste is under control. - A large gap signals that something is happening between the delivery door and the guest's plate that your recipes do not account for. This benchmark also helps you judge your target. If your theoretical food cost is already 33%, expecting an actual food cost of 28% is unrealistic. Likewise, if your theoretical figure is 29% and your actual is 35%, you know the problem lies in execution rather than in menu design or pricing. A few limitations are worth keeping in mind - - It is only as accurate as your recipe cards. Outdated costs or missing ingredients will produce a misleadingly low figure. - It assumes standard yields. Trim loss and cooking shrink need to be built into recipes, or the benchmark will be unrealistically optimistic. - It cannot be zero variance. Some waste and minor error are inevitable, so the goal is to keep the gap small and stable, not to eliminate it entirely.
Formulas and Calculations
Now that both measures are defined, this section shows how to calculate each one. The examples use simple sample numbers so you can follow the math and then replace them with your own figures. The Actual Food Cost Formula Cost of Food Used = Beginning Inventory + Purchases - Ending Inventory Actual Food Cost % = Cost of Food Used / Food Sales x 100 Worked example (one month) - ItemAmount
| Beginning inventory | $12,000 |
| Purchases during the month | $31,000 |
| Ending inventory | $11,000 |
| Food sales | $120,000 |
| Grilled chicken plate | $4.20 | 2,000 | $8,400 | $30,000 |
| Beef burger | $3.80 | 2,500 | $9,500 | $32,500 |
| Pasta primavera | $2.10 | 1,500 | $3,150 | $18,000 |
| House salad | $1.60 | 1,800 | $2,880 | $14,400 |
| Total | 7,800 | $23,930 | $94,900 |
| Actual food cost | $32,000 | 26.7% |
| Theoretical food cost | $28,800 | 24.0% |
| Gap | $3,200 | 2.7 points |
Comparing Actual to Theoretical
Variance analysis is the step that turns two separate numbers into useful information. By comparing actual food cost to theoretical food cost, you can see how much money is leaving your kitchen unaccounted for and begin to track down where it is going. How to Calculate Food Cost Variance Variance can be expressed in two ways, and it helps to track both. Dollar Variance = Actual Food Cost ($) - Theoretical Food Cost ($) Percentage Variance (in points) = Actual Food Cost % - Theoretical Food Cost % Using the figures from Section 4 - MeasureDollarsPercentage
| Actual food cost | $32,000 | 26.7% |
| Theoretical food cost | $28,800 | 24.0% |
| Variance | $3,200 | 2.7 points |
Common Causes of Food Cost Variance
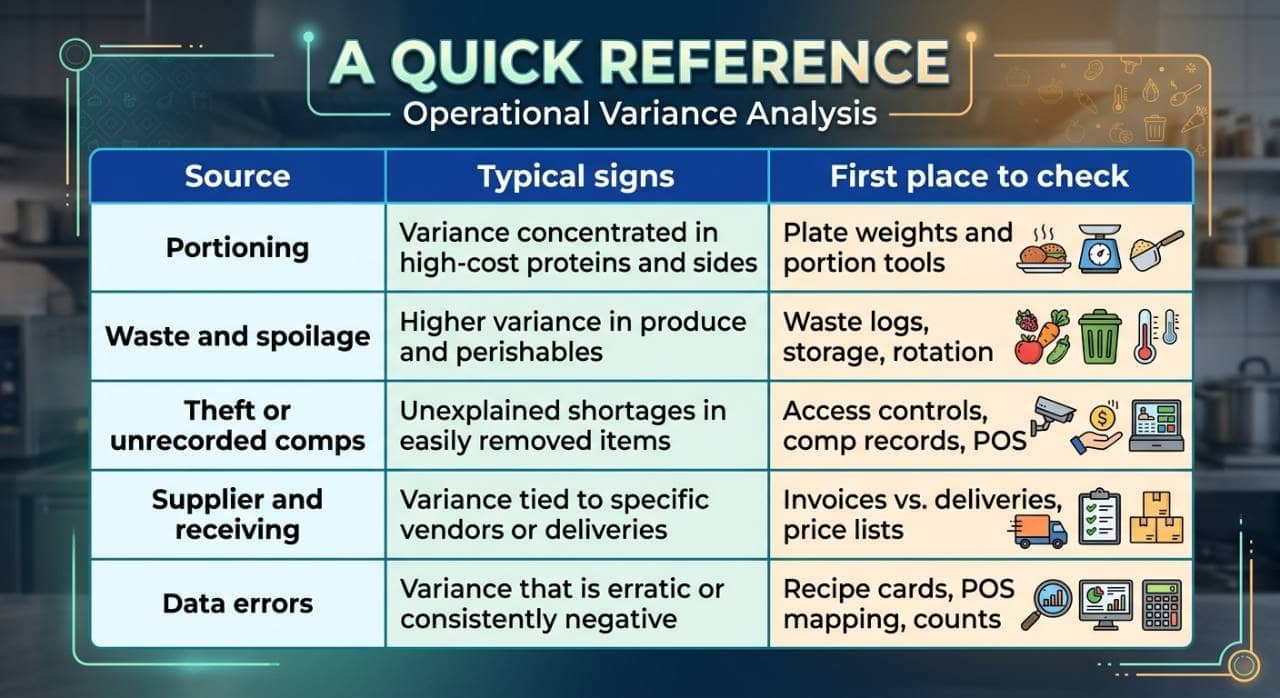
A food cost variance rarely comes from a single source. More often it is the combined result of several small issues, some in the kitchen, some at the back door, and some in the data itself. Knowing the usual suspects helps you narrow your search quickly. The causes below are grouped by where they tend to originate. Over-Portioning and Inconsistent Prep Portioning is one of the most frequent and least visible drivers of variance. When a recipe calls for 6 ounces of protein and the plate carries 7, the cost difference looks trivial on one dish but becomes significant across hundreds of covers. Typical sources include - - No portioning tools, such as scales, scoops, ladles, or portion cups - Different cooks plating differently, especially across shifts - "Eyeballing" portions during busy service - Overly generous side dishes, sauces, and garnishes - Inconsistent cutting and prep, which changes yield from batch to batch A small overage on a high-cost item such as steak, shrimp, or cheese can have an outsized effect on your total variance. Waste, Spoilage, and Trim Loss Every kitchen loses some product, but unmanaged loss quickly erodes margins. Waste generally falls into three groups - 1. Spoilage - food that expires or deteriorates because of over-ordering, poor rotation, or improper storage temperatures 2. Prep and trim waste - product lost during butchering, peeling, and trimming beyond what recipes assume 3. Production errors - burned, dropped, overcooked, or incorrectly prepared dishes that must be remade, and returned plates If recipes use purchase cost rather than usable cost, normal trim loss will show up as variance even when the kitchen is performing well. Tracking waste in a log, with reasons, helps you separate unavoidable loss from preventable loss. Theft and Unrecorded Comps Not all variance is accidental. Unrecorded product leaving the building, whether as employee theft or informal giveaways, adds to actual usage without adding to sales. Common forms include - - Food taken out of the restaurant by staff or through back-door deliveries - Unrecorded staff meals and tastings - Comps and discounts given without being rung into the POS - Deliveries that are signed for but not fully received Because theft is sensitive, the best defense is structural rather than accusatory - clear policies, controlled access to storage, and consistent receiving and recording practices. Supplier Pricing Changes and Receiving Errors The back door of the restaurant is another common source of leakage. Variance can arise here even when the kitchen performs flawlessly. - Price increases that are not reflected in recipe costs, causing actual cost to rise while theoretical cost stays the same - Short deliveries, where fewer units arrive than are invoiced - Substitutions or lower-quality product delivered in place of what was ordered - Incorrect weights on proteins and produce sold by the pound - Invoices entered incorrectly or not entered at all - Missed credits for damaged or returned goods Checking every delivery against the purchase order and invoice, and checking weights and quality on the spot, prevents many of these issues. Inaccurate Recipes, POS Errors, and Inventory Miscounts Sometimes the kitchen is performing well and the variance is a data problem. Because both actual and theoretical costs rely on records, errors in those records produce a gap that does not reflect real loss. - Outdated recipe cards that omit ingredients or use old costs - POS items mapped to the wrong recipe, or modifiers and combos that are not linked at all - Menu changes that were not updated in the costing system - Counting errors, such as missed storage areas, double-counted items, or estimated partial cases - Unit-of-measure mistakes, such as counting cases as individual units - Timing mismatches between when inventory is counted and when sales are closed out Before concluding that product is being lost, it is wise to rule out data errors. A variance that disappears after correcting a recipe or recounting a walk-in was never a real loss, but it was still worth finding.
Cost-Control Strategies to Close the Gap
Once you know where variance is coming from, the goal is to fix it in a way that lasts. The strategies below build on one another - standard recipes and portions create consistency, tighter purchasing and storage reduce loss, smarter menu and pricing decisions improve margins, and training and technology keep everything on track. Standardize Recipes and Portion Control Consistency is the foundation of cost control. If every cook makes a dish differently, no benchmark will be reliable. - Write standardized recipe cards with exact ingredients, quantities, yields, and plating instructions, and keep them accessible on the line. - Use portioning tools such as digital scales, scoops, ladles, portion cups, and pre-marked containers. - Pre-portion high-cost items like proteins and cheese during prep rather than during service, when speed pressure leads to guesswork. - Include plating photos or guides so that portions and presentation look the same across shifts. - Spot-check plates during service by weighing a few portions each shift, especially of high-cost items. - Update cards immediately whenever a recipe, supplier, or portion changes. Many losses occur before an ingredient ever reaches the kitchen line. Strong back-of-house processes protect the money you have already spent. Ordering - Set par levels for each item based on actual sales patterns, and order to par rather than by habit or by eye. - Review sales forecasts and upcoming events before placing orders to avoid over-ordering perishables. - Consolidate purchasing with fewer suppliers where possible to improve pricing and simplify invoice checking. - Compare prices across vendors regularly and negotiate on high-volume items. Receiving - Assign a trained person to receive deliveries, and avoid receiving during the busiest service periods. - Check every delivery against the purchase order and invoice - quantities, weights, quality, temperatures, and prices. - Reject or request credit for damaged, substandard, or short-shipped product immediately. - Keep a receiving log and ensure all invoices are entered promptly. Storage - Apply FIFO (first in, first out) with clear labeling and date marking on every container. - Keep storage areas organized and temperatures monitored to reduce spoilage. - Limit access to storerooms and walk-ins, and keep high-value items such as proteins and seafood in controlled areas. - Use a waste log that records the item, quantity, and reason, then review it regularly to identify patterns. Menu Engineering and Pricing Adjustments Not every variance problem is a kitchen problem. Sometimes the menu itself is the lever. - Analyze item profitability and popularity together. Classify dishes as high or low margin and high or low popularity, then act accordingly - promote the high-margin favorites, reprice or rework the popular low-margin items, and consider removing items that are both unpopular and unprofitable. - Adjust prices strategically. Review the cost of your highest-cost dishes and raise prices where the market allows, rather than applying a flat increase across the board. - Rework recipes to lower cost without noticeably changing quality, such as adjusting garnishes, sides, or secondary ingredients. - Reduce menu complexity. A smaller menu with shared ingredients simplifies ordering, reduces waste, and makes inventory easier to manage. - Use specials to move inventory that is approaching its end of life, and feature ingredients with favorable pricing. - Design menu layout thoughtfully so that high-margin items receive prominent placement. Staff Training and Accountability Systems only work when people understand and follow them. - Train every cook and prep team member on portion standards, recipe adherence, proper storage, and waste handling. - Explain the why. When staff understand how small overages affect the business, they are more likely to follow procedures. - Assign ownership. Make specific individuals responsible for ordering, receiving, inventory counts, and waste logging. - Share results. Reviewing variance figures with kitchen leadership each week keeps cost control visible. - Set clear goals and recognize progress, such as reaching a target variance, so that cost control is seen as a shared objective. - Establish clear policies for staff meals, comps, and discounts, and require that all be recorded in the POS. - Hold regular pre-shift meetings to reinforce standards and discuss recent issues. Use Inventory and Food Cost Software Manual tracking can work for small operations, but it becomes time-consuming and error-prone as complexity grows. Dedicated tools can make the process faster and more precise. Useful capabilities include - - Automated theoretical food cost calculated from POS sales data and recipe costs - Invoice capture and price tracking that update ingredient costs automatically - Digital inventory counts using mobile devices, with consistent item lists and units - Variance reports by category, item, and time period - Alerts when ingredient prices change or variances exceed set thresholds - Waste tracking with reasons and trends Software does not fix problems on its own, but it removes much of the manual work and makes patterns easier to see. Choose a tool that integrates with your POS and accounting system, and make sure your recipes and item mappings are accurate before relying on its output. Prioritize and Sustain Trying to fix everything at once usually leads to fixing nothing well. A simple approach - 1. Start with the largest variances, typically high-cost proteins and perishables. 2. Fix the data first, so you are acting on real problems rather than recording errors. 3. Address one or two root causes at a time, and measure the result at the next variance review. 4. Build habits into routine, such as weekly counts, daily waste logs, and delivery checks. 5. Review regularly and adjust targets as your menu, prices, and operations change.