Hardee's Taps Alisa Gmelich as New President
CKE Restaurants names marketing veteran Alisa Gmelich President of Hardee's, tasking her with rebuilding franchisee trust and driving growth.
News
Oct 7, 2026
CKE Restaurants names marketing veteran Alisa Gmelich President of Hardee's, tasking her with rebuilding franchisee trust and driving growth.
Oct 7, 2026

Understand overtime rules for restaurant employees, including eligibility, pay calculations, hours worked, compliance requirements, timekeeping, and overtime management.
Oct 7, 2026

POS data helps restaurant owners control food costs by improving purchasing, reducing waste, optimizing portions, analyzing profitability, and managing inventory.
Oct 7, 2026
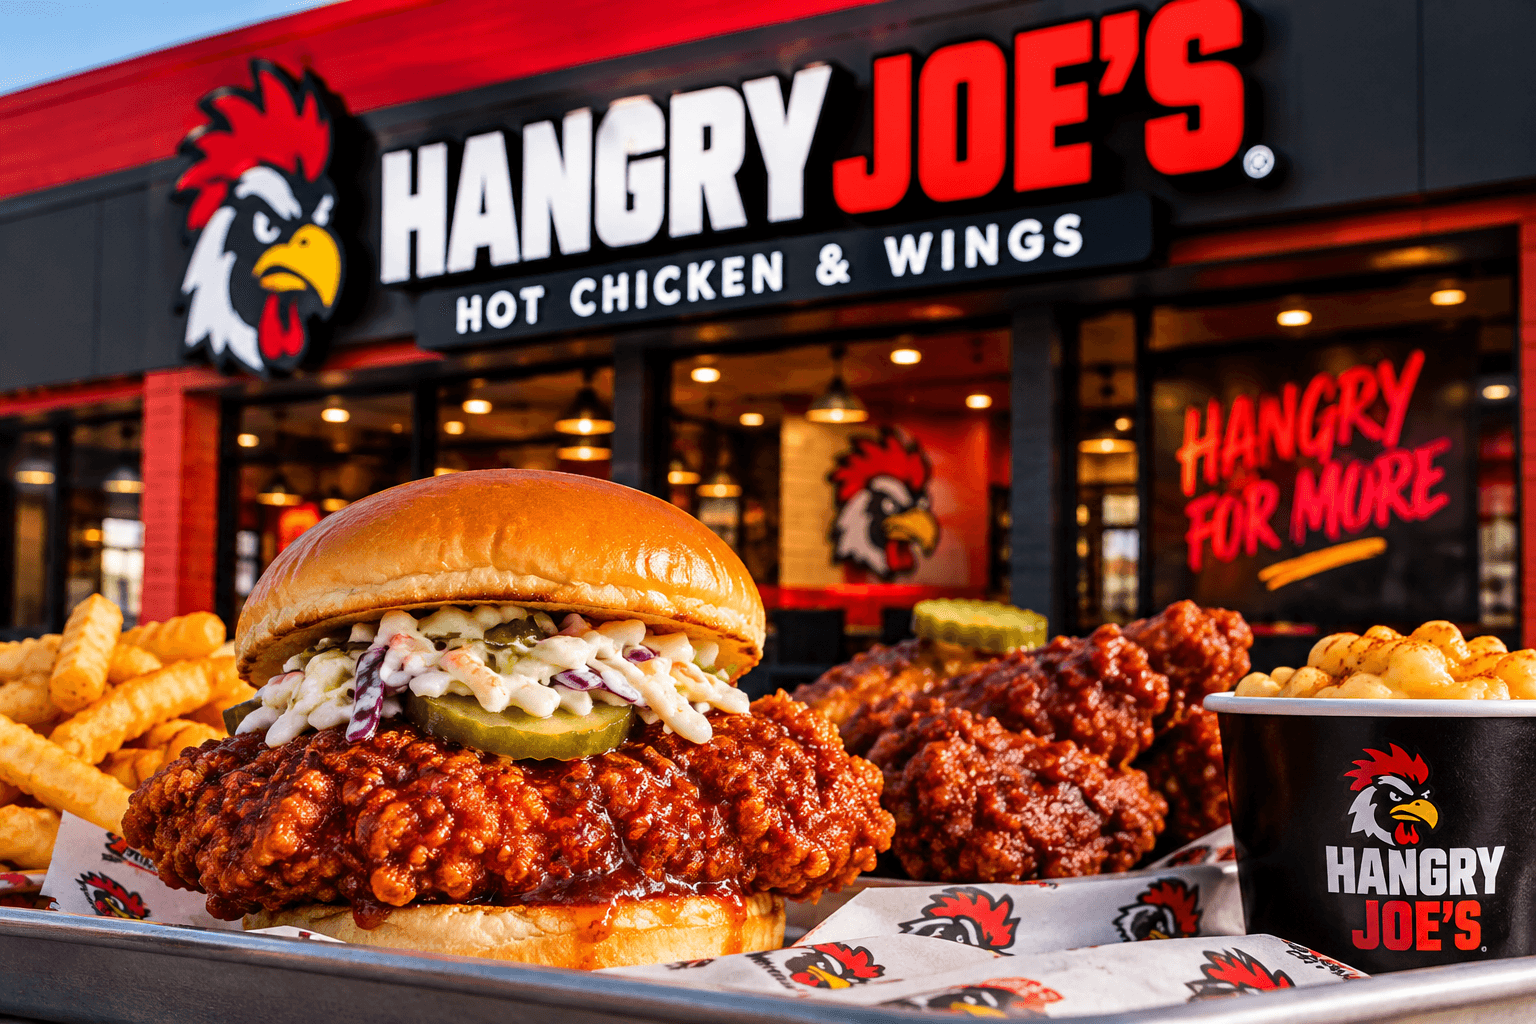
Hangry Joe's promotes insider Brandon Wilhelm to CEO, prioritizing franchisee profitability over rapid unit growth as the chain expands past 90 locations.
Oct 6, 2026
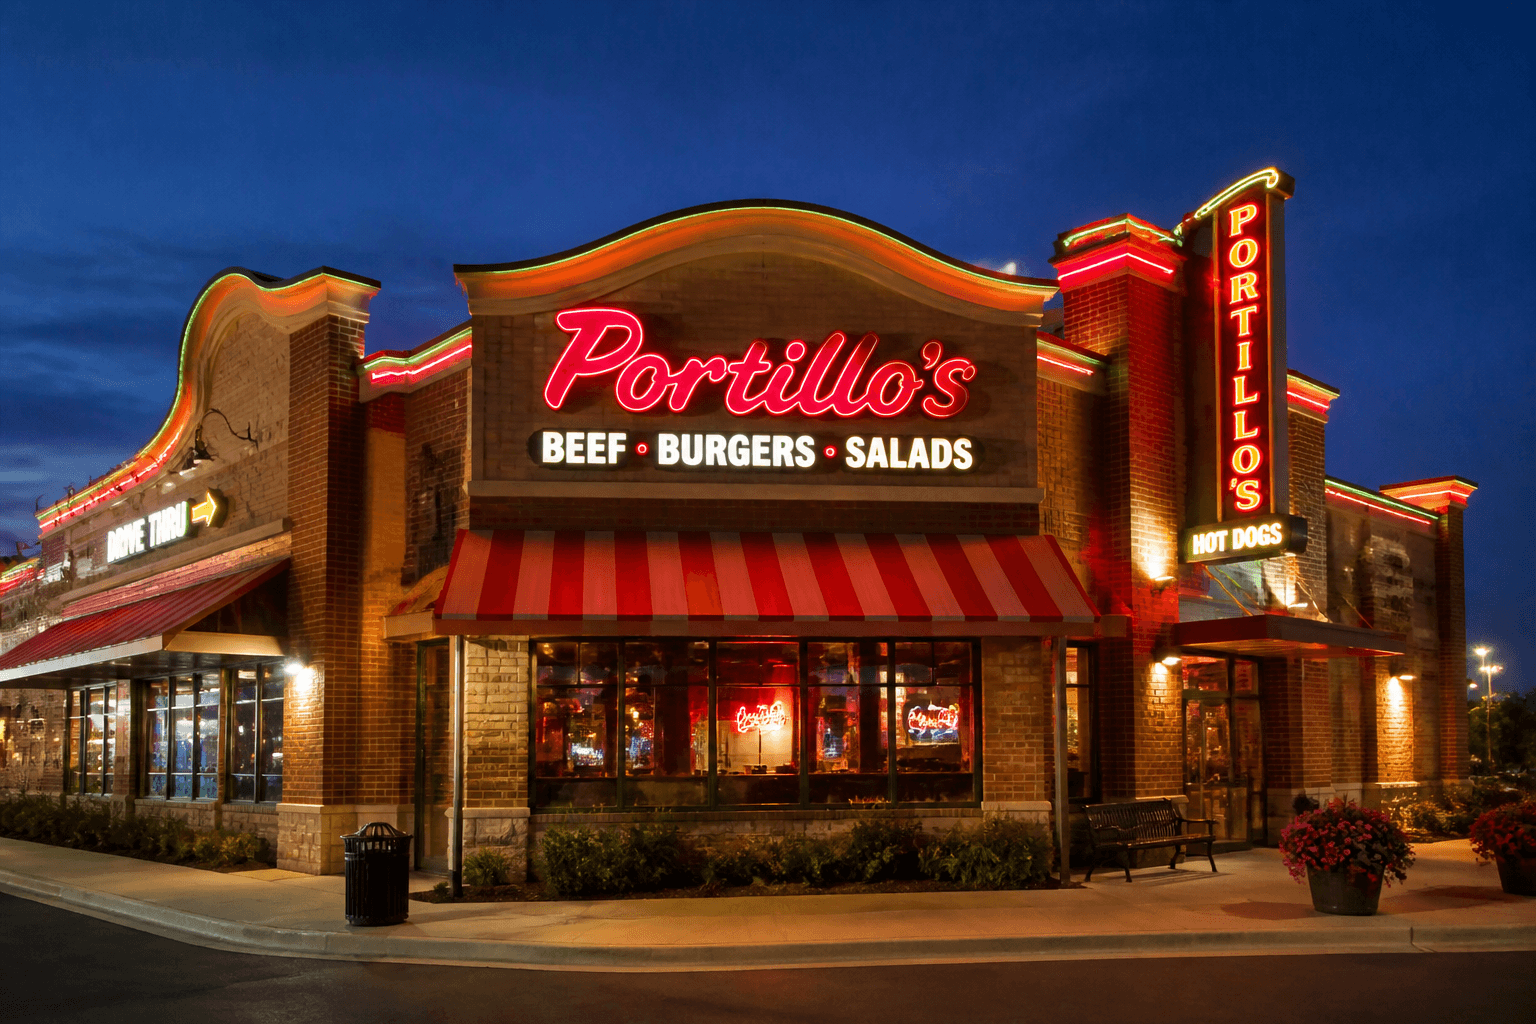
Portillo's chief people officer Jill Waite departs as new CEO Brett Patterson reshapes leadership with layoffs and fresh executive hires.
Oct 6, 2026
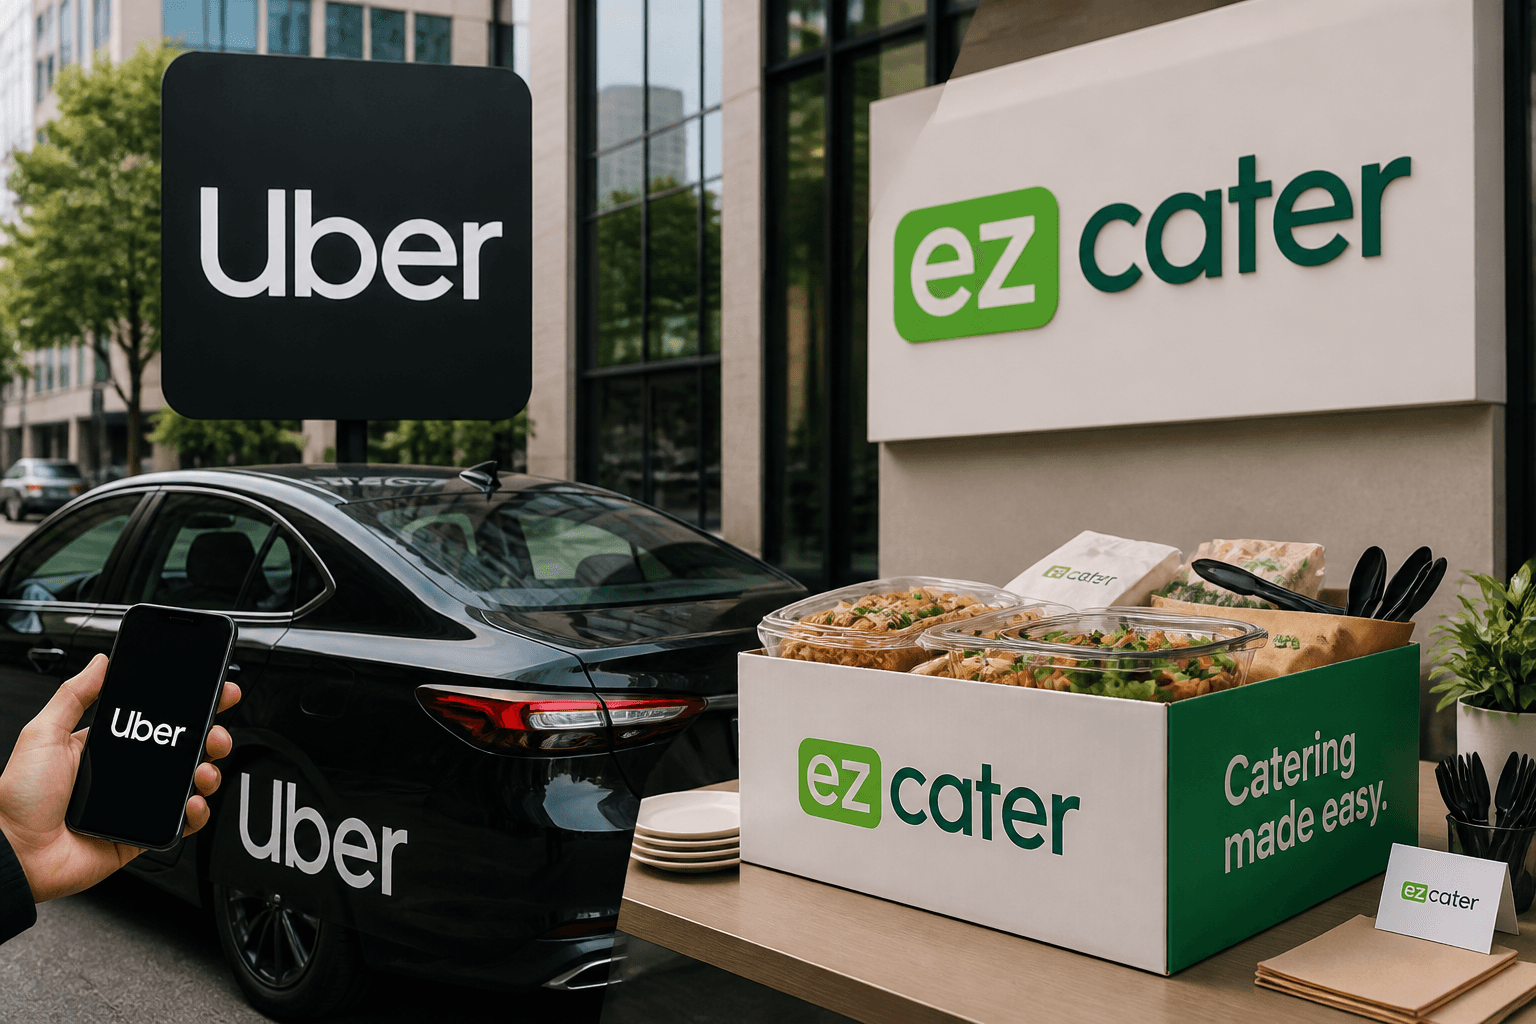
Uber is paying $2.3 billion to acquire ezCater, merging its catering network into Uber Eats and Uber for Business to enter workplace catering.
Oct 6, 2026
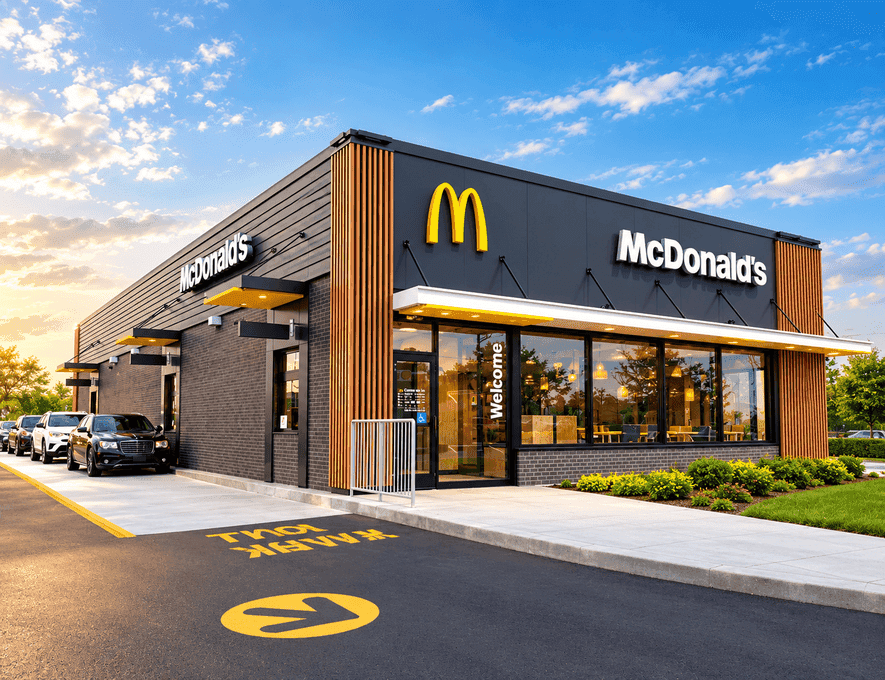
A new lawsuit claims McDonald's pricing tool pressures franchisees into algorithmic price-fixing, raising fresh antitrust questions for the chain.
Oct 6, 2026

True Food Kitchen filed for Chapter 11 bankruptcy, closing 12 locations and shrinking to 34 restaurants across 14 states amid $42.1 million in debt.
Oct 5, 2026

Snooze Eatery names industry veteran Amy Hom as COO, starting Sept. 28, to strengthen hospitality and operations ahead of its next growth phase.
Oct 5, 2026

Opening a second restaurant location requires readiness, clear goals, financial planning, funding, smart strategy, standardized operations, strong teams, and careful launch monitoring for sustainable growth.
Sep 30, 2026

Unlock Exclusive Access To Webinars, Events, And The Latest News For Free!
POS data helps restaurant owners control food costs by improving purchasing, reducing waste, optimizing portions, analyzing profitability, and managing inventory.
Instead of relying on estimates, restaurant owners can use POS data to identify sales patterns by menu item, day, time, location, and sales channel. For example, sales reports can show that a particular entree sells significantly more during dinner than lunch. This information can help managers adjust preparation and purchasing quantities to better match actual demand. POS data can also help identify menu items that may be affecting food costs. A high-volume item with expensive ingredients may generate substantial sales but still produce a lower contribution margin. In contrast, a lower-cost item that sells consistently may contribute more to profitability. Reviewing sales volume alongside ingredient costs gives restaurant owners a clearer view of which products deserve attention. Several POS metrics can support food cost control, including - 1. Menu item sales - Shows which products generate the most and least demand. 2. Sales by day and daypart - Helps identify recurring demand patterns for better preparation and purchasing. 3. Item mix - Shows the percentage of total sales generated by individual menu items. 4. Voids and canceled orders - Can help identify products or processes associated with unnecessary food usage. 5. Discounts and promotions - Shows how pricing decisions affect sales and revenue. 6. Sales by location or channel - Helps multi-unit restaurants identify differences in customer demand. The most useful approach is to connect these sales insights to purchasing, inventory, recipes, and waste. If POS data shows that demand for a menu item is declining, purchasing less of its perishable ingredients may prevent excess inventory and spoilage. If sales consistently increase during a particular daypart, managers can prepare the appropriate ingredients based on actual demand rather than relying on guesswork. POS data does not reduce food costs by itself. Its value comes from turning transaction data into operational decisions. When restaurant owners regularly analyze sales patterns and connect them to ingredient usage, they can identify where food costs are increasing and determine which changes can improve control.
Understanding which menu items sell consistently and which struggle to generate demand can help restaurant owners make better food cost decisions. A POS system provides item-level sales data that shows how frequently each menu item is ordered, allowing managers to compare sales performance with ingredient costs. Start by reviewing the number of units sold for each menu item over a consistent period, such as a week or month. High-volume items should receive close attention because they account for a large share of ingredient usage. However, high sales do not automatically mean high profitability. An item may sell hundreds of times while using expensive proteins, specialty ingredients, or large quantities of other high-cost components. Compare sales volume, selling price, and ingredient cost for each menu item. This helps determine the contribution each item makes after accounting for its food cost. For example, two menu items may generate similar sales revenue, but the item with lower ingredient costs may contribute more toward covering labor and other operating expenses. Low-selling items require a different type of analysis. Ingredients purchased for slow-moving menu items can remain in storage longer, increasing the risk of spoilage, expiration, or unnecessary inventory. If a menu item consistently generates little demand, restaurant owners can evaluate whether its ingredients are used elsewhere or whether the item should be reformulated, repositioned, or removed from the menu. POS data can also reveal changes in customer preferences. Comparing menu-item sales over several weeks or months can show whether demand is increasing, declining, or remaining stable. Seasonal patterns, promotions, price changes, and menu changes can then be evaluated against actual sales performance. Restaurant owners should regularly review - 1. Units sold - Identify high- and low-demand menu items. 2. Sales revenue - Determine which items generate the most revenue. 3. Food cost per item - Understand how much each item costs to produce. 4. Contribution margin - Compare the selling price with the item's food cost. 5. Item mix - Measure each menu item's share of total sales. 6. Sales trends - Identify changes in demand over time. POS data should helps restaurant owners understand the relationship between customer demand and food cost. Using that information, managers can focus purchasing, preparation, and menu decisions on the items that have the greatest effect on overall food costs.
Food purchasing decisions have a direct effect on restaurant food costs. Ordering too much can increase spoilage, storage costs, and waste, while ordering too little can create stockouts and require expensive last-minute purchases. POS sales data can help restaurant owners base purchasing decisions on actual demand rather than estimates. Review sales trends for individual menu items and the ingredients they require. POS reports can show how many units of an item were sold during specific days, weeks, or dayparts. Comparing these patterns over time can help managers identify recurring demand. For example, if a restaurant consistently sells more chicken entrees on weekends, purchasing and preparation quantities can be adjusted accordingly. Historical POS data can also support demand forecasting. Reviewing several weeks or months of sales can reveal seasonal patterns, changes in customer preferences, and differences between weekdays and weekends. Restaurant owners can use these patterns when determining how much food to purchase for upcoming operating periods. Sales trends should also be evaluated by daypart. Breakfast, lunch, dinner, and late-night periods can have significantly different demand patterns. If a particular ingredient is primarily used during one daypart, managers can adjust preparation and purchasing based on the expected volume for that period rather than preparing the same quantity every day. Promotions and menu changes should also be considered. A discount or limited-time offer may temporarily increase demand for specific menu items and their ingredients. POS data can help managers measure the actual sales impact of these changes and adjust purchasing accordingly. Restaurant owners can use POS sales trends to - 1. Identify recurring demand patterns by day, week, month, and daypart. 2. Estimate ingredient requirements based on expected menu-item sales. 3. Reduce over-ordering by aligning purchases with actual demand. 4. Prepare for seasonal changes using historical sales information. 5. Monitor promotional demand and adjust purchasing when sales increase. 6. Reduce stockouts by identifying consistently high-demand menu items. Purchasing should not rely on POS data alone. Inventory levels, supplier lead times, shelf life, upcoming promotions, and current stock should also be considered. However, using POS sales trends as a starting point gives restaurant managers a more reliable basis for deciding what to purchase and how much to order. The objective is to maintain enough inventory to meet customer demand without consistently carrying more food than the restaurant can reasonably use. When purchasing decisions are tied to actual sales patterns, restaurants can improve inventory turnover and reduce the food costs associated with excess ingredients and spoilage.
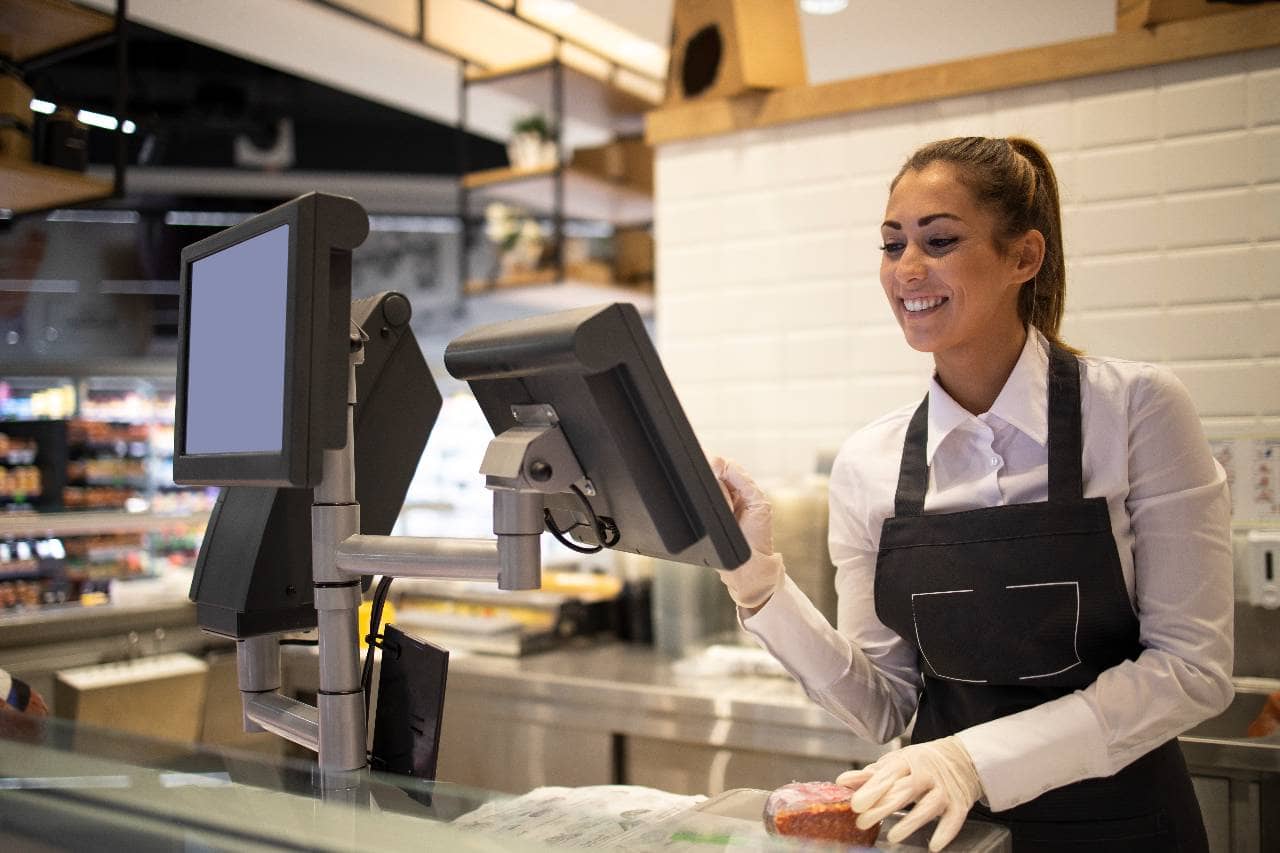
Food waste can increase restaurant food costs when ingredients are purchased, prepared, or portioned without sufficient customer demand. POS data gives restaurant owners a way to identify where sales patterns do not match food preparation and purchasing decisions. One of the most useful applications is comparing what the restaurant prepares with what it actually sells. If a menu item consistently has low sales, preparing large quantities of its ingredients can result in excess food that may eventually need to be discarded. POS reports can identify these slow-moving items so managers can adjust preparation quantities. Sales data can also help identify ingredients associated with specific menu items. If an ingredient is primarily used in a low-volume dish, managers can evaluate whether purchasing smaller quantities or using the ingredient across multiple menu items would reduce waste. This is particularly important for perishable products with short shelf lives. Restaurant owners should also review POS records for voids, canceled orders, discounts, and remakes. These transactions can reveal operational issues that result in food being prepared without generating a completed sale. A high number of voided or remade items may indicate problems with order accuracy, preparation, communication, or customer requests. Daily and weekly sales patterns can further improve production planning. Instead of preparing the same quantity every day, managers can use historical POS data to estimate demand for specific periods. For example, if sales reports show significantly lower demand for a particular entree on certain weekdays, preparation levels can be adjusted accordingly. Restaurant owners can use POS data to identify - 1. Slow-selling menu items that may cause excess ingredient inventory. 2. Low-demand periods where preparation quantities can be reduced. 3. Voids and canceled orders that may result in unnecessary food usage. 4. Remakes and order errors that can create avoidable waste. 5. Promotional spikes that require temporary increases in preparation. 6. Declining sales trends that may require purchasing adjustments. POS data becomes even more useful when combined with a waste log. Managers can record what was discarded, how much was discarded, and why it was discarded, then compare that information with sales trends. This creates a clearer picture of whether waste is primarily connected to overproduction, spoilage, preparation errors, or other operational issues. POS data should help managers match preparation and purchasing more closely with actual sales, reducing unnecessary waste while maintaining menu availability.
Consistent portions are essential for controlling food costs. When employees use different quantities of ingredients for the same menu item, actual food costs can rise even when sales remain stable. POS data can help restaurant owners identify which menu items are sold most frequently and determine where consistent recipes and portion standards can have the greatest impact. Start by connecting each menu item to a standardized recipe that specifies the ingredients and quantities required for one serving. The POS system can then provide the number of items sold, while recipe information can be used to estimate how much of each ingredient should have been consumed. For example, if a restaurant sells 500 servings of an entree and its standardized recipe calls for four ounces of chicken per serving, the expected chicken usage can be calculated from those sales. Comparing expected usage with actual inventory consumption can help managers identify potential variances. Recipe costing also helps restaurant owners understand the true food cost of individual menu items. Ingredient prices can change over time, so regularly updating recipe costs helps ensure that menu profitability calculations remain accurate. If the cost of a key ingredient increases significantly, the restaurant can evaluate whether the menu price, recipe, supplier, or portion size needs to be adjusted. POS data can support this process by showing which menu items account for the largest share of sales. High-volume items may deserve greater attention because even a small portion variance can have a meaningful effect when multiplied across hundreds or thousands of transactions. Restaurant owners should monitor - 1. Standard portion sizes - Establish consistent ingredient quantities for every menu item. 2. Recipe costs - Calculate the ingredient cost required to produce each serving. 3. Units sold - Use POS data to determine how frequently each recipe is being produced. 4. Expected ingredient usage - Calculate how much inventory should be consumed based on sales. 5. Actual ingredient usage - Compare expected consumption with inventory movement. 6. Cost variances - Investigate significant differences between expected and actual usage. Portion control should not be viewed solely as an employee performance issue. Variances can result from inaccurate recipes, changing ingredient sizes, preparation methods, waste, spoilage, or incorrect inventory records. Reviewing POS sales alongside recipe and inventory data gives managers more information to determine the likely source of the difference. When recipes, portions, and POS sales data are aligned, restaurant owners gain a clearer understanding of how menu sales translate into ingredient consumption. This makes it easier to identify cost increases, maintain consistent portions, and protect food margins as sales volume changes.
Food cost percentage shows how much of a restaurant's sales revenue is being used to pay for the food and ingredients sold. Monitoring this metric alongside POS sales data helps restaurant owners determine whether menu sales are generating enough revenue relative to ingredient costs. The basic food cost percentage formula is - Food Cost Percentage = (Cost of Food Sold / Food Sales) x 100 For example, if a restaurant has $8,000 in food costs and generates $24,000 in food sales during the same period, its food cost percentage is 33.3%. Tracking this percentage consistently can help managers identify changes in food costs that may not be obvious from sales revenue alone. POS data provides the sales component of this calculation and can also help break performance down by individual menu items. Restaurant owners can compare the selling price and ingredient cost of each item to determine its contribution margin. An item that generates significant sales but requires expensive ingredients may have a smaller contribution margin than expected. Menu profitability should therefore be evaluated using more than sales volume. Consider three factors together - 1. Sales volume - How frequently the item is purchased. 2. Food cost - How much it costs to produce the item. 3. Contribution margin - How much revenue remains after the item's food cost. This analysis can help restaurant owners identify different types of menu items. A high-volume, high-margin item may deserve greater promotional attention, while a high-volume item with a low contribution margin may require recipe, pricing, or portion adjustments. A low-volume item with a high food cost may also warrant closer review because it can tie up ingredients without generating enough sales. Restaurant owners should also monitor food cost percentage over time rather than relying on a single reporting period. Weekly and monthly comparisons can reveal whether food costs are increasing faster than sales. Changes in ingredient prices, menu pricing, purchasing practices, waste, and portion sizes can all affect the result. POS reports can make these comparisons easier by providing detailed sales information for individual menu items, categories, dayparts, and locations. When this sales information is combined with accurate ingredient costs, restaurant owners can identify which parts of the menu are putting pressure on food margins. The objective is not necessarily to achieve the lowest possible food cost percentage. Cutting ingredient costs too aggressively can affect portion sizes, product quality, and customer satisfaction. Instead, restaurant owners should use POS data to find the right balance between food cost, sales volume, menu pricing, and profitability.

POS data shows what a restaurant sells, while inventory data shows what ingredients are available, purchased, and used. Combining these two sources gives restaurant owners a more complete view of food costs and makes it easier to identify differences between expected and actual ingredient usage. For example, a POS system may show that a restaurant sold 300 servings of a particular menu item during a week. If the standardized recipe requires four ounces of chicken per serving, the expected chicken usage would be 75 pounds. Managers can compare this figure with actual inventory usage to determine whether the numbers are reasonably aligned. Differences between expected and actual usage can have several causes. Food waste, spoilage, incorrect portioning, recipe changes, theft, receiving errors, or inaccurate inventory counts can all contribute to inventory variances. A POS system cannot identify the cause by itself, but it provides the sales data needed to begin investigating the difference. Restaurant owners should regularly compare - 1. POS sales - How many units of each menu item were sold. 2. Recipe quantities - How much of each ingredient should be required per serving. 3. Purchasing records - How much inventory was purchased during the period. 4. Beginning and ending inventory - How much product was available and remaining. 5. Actual usage - How much inventory was consumed during the period. 6. Inventory variance - The difference between expected and actual usage. Integrated POS and inventory systems can make this process more efficient by connecting sales transactions with ingredient usage. Instead of manually calculating ingredient requirements from individual sales reports, managers can use system-generated data to identify potential variances more quickly. This information can also improve purchasing decisions. If inventory reports show that a restaurant consistently carries more of a particular ingredient than its sales volume requires, purchasing quantities may need to be adjusted. Conversely, frequent stockouts may indicate that inventory levels are too low relative to actual demand. Restaurant owners should establish a regular review schedule rather than waiting until food costs become a major problem. High-cost ingredients and high-volume menu items can be reviewed more frequently, while broader inventory and food cost analysis can be performed weekly or monthly. The goal is to connect what was sold with what was purchased and consumed. When POS and inventory data work together, restaurant owners can identify food cost variances earlier, improve purchasing accuracy, reduce unnecessary inventory, and make more informed decisions about menu and operational changes.
Using POS data effectively requires a consistent review process. Restaurant owners can collect large amounts of sales information, but the data only becomes useful when managers regularly analyze it and use the findings to make purchasing, preparation, inventory, and menu decisions. Start by establishing which POS reports should be reviewed and how frequently. Daily reviews can focus on sales volume, unusual changes in menu-item demand, voids, canceled orders, and other transactions that may affect food usage. Weekly reviews can provide a broader view of food cost trends, inventory movement, waste, and menu performance. Monthly reviews can be used to evaluate longer-term changes in food cost percentage and profitability. A practical POS-based food cost routine can include - 1. Review daily sales - Identify unusual changes in demand and high-volume menu items. 2. Check item performance weekly - Compare sales volume, food cost, and contribution margin. 3. Analyze purchasing patterns - Compare orders with historical sales and current inventory. 4. Review waste and variances - Identify differences between expected and actual ingredient usage. 5. Monitor food cost percentage - Track changes over time and investigate significant increases. 6. Evaluate menu performance - Identify items that may require pricing, recipe, portion, or menu changes. 7. Set measurable targets - Establish goals for food cost percentage, waste, inventory variance, and other relevant metrics. The review process should also assign responsibility. Managers should know which reports they are expected to review, how often they should review them, and what actions should follow when a metric moves outside its target range. This turns POS reporting into an operational process rather than a collection of unused data. It is also important to compare POS information with other restaurant records. Sales data should be evaluated alongside inventory counts, purchasing invoices, recipe costs, and waste records. Looking at these metrics together can help managers determine whether rising food costs are caused by ingredient price increases, changing sales patterns, excess purchasing, waste, or portion inconsistencies. Over time, this routine can create a continuous feedback loop. POS sales data identifies demand, demand informs purchasing and preparation, inventory data measures actual usage, and food cost analysis identifies areas that need improvement. Managers can then use the next set of POS reports to determine whether those changes produced the expected results. Restaurant owners do not need to analyze every available POS metric. The most effective approach is to focus on the data that directly connects sales with food costs and establish a repeatable process for acting on those insights. Consistent analysis can help restaurants reduce waste, improve purchasing decisions, maintain portion consistency, and protect food margins.